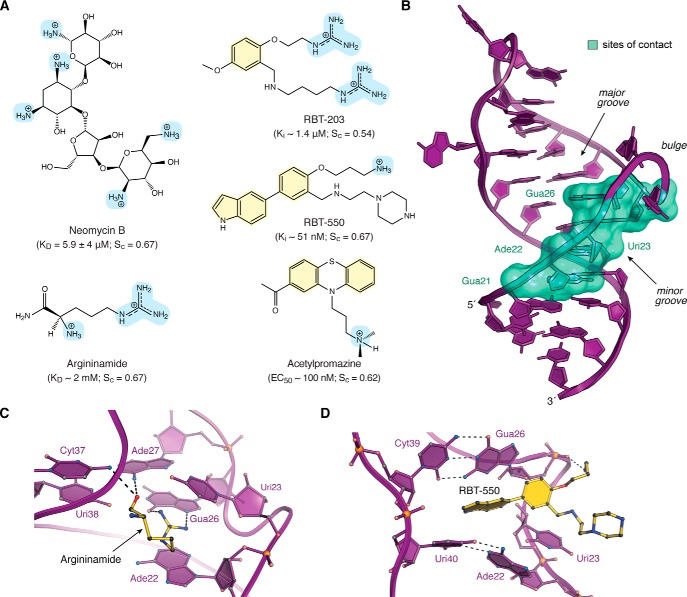
Figure 3.
Chemical structures, interaction properties, and representative modes of small-molecule binding to HIV TAR. A, chemical diagrams for various small molecules that bind TAR and have been characterized structurally by experimental approaches. Positively charged groups are light blue, and aromatic rings are pale yellow. Equilibrium KD values for TAR binding to neomycin and argininamide were derived from NMR (69, 92). Ki values for RBT-203 and RBT-550 were measured for the ability to displace a Tat-derived peptide from TAR, as monitored by FRET (106, 107). The EC50 value of acetylproamizine was estimated based on an EMSA analysis of concentration-dependent disruption of a TAR–Tat–CycT1 complex (64). Here and elsewhere, shape correlation coefficients for RNA–ligand interfaces were calculated by the program Sc on a scale of 0 to 1.0 (102). Calculations in A were applied to the following: TAR–neomycin (PDB entry 1qd3) (92); TAR–argininamide (PDB entry 1akx) (69); TAR–RBT-203 (PDB entry 1uub) (107); TAR–RBT550 (PDB entry 1uts) (106); and TAR–acetylpromazine (PDB entry 1lvj) (64). Sc values are the average derived from the reported NMR ensembles. Solvent-accessible surface areas of RNA–ligand interfaces were calculated by PISA (153). B, ribbon diagram of HIV-1 TAR (PDB entry 6cmn) (77) depicting the locations of nucleotides (green surface) that interact with various small molecules in Table 1. Most ligands bind in the major groove at the interface between s1a and s1b; neomycin binds in the minor groove (92). C, ribbon and ball–and–stick diagram of HIV-2 TAR in complex with argininamide. D, ribbon and ball–and–stick diagram of HIV-1 TAR in complex with RBT-550.

