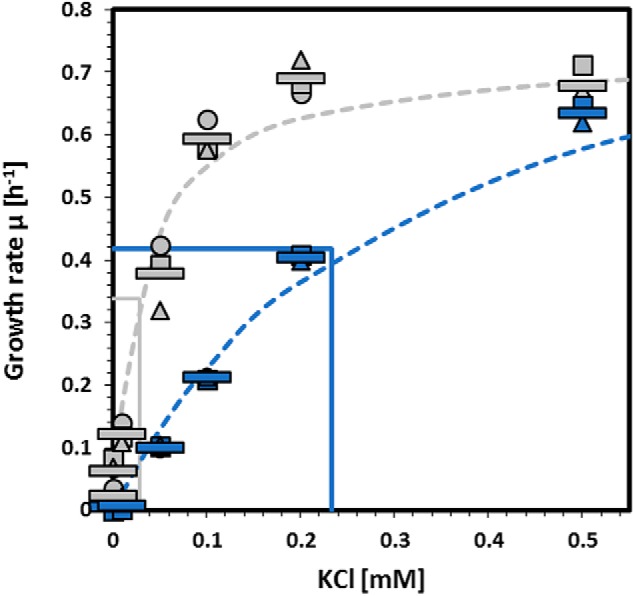
Figure 1.

Activity of KimA variant proteins in a heterologous complementation assay. E. coli LB2003 was transformed with pGP2913 (WT KimA, gray) and pGP2993 (KimA-W520G, blue), respectively, and growth at different potassium concentrations was assessed over 24 h. The growth rate μ was determined and plotted against the potassium concentrations. Dashed lines show the ideal progression of μ over the different potassium concentrations according to the Monod equation, and continuous lines show the determined KS. Circles, squares, and triangles represent independent biological replicates. The bars indicate the means of the replicates.
