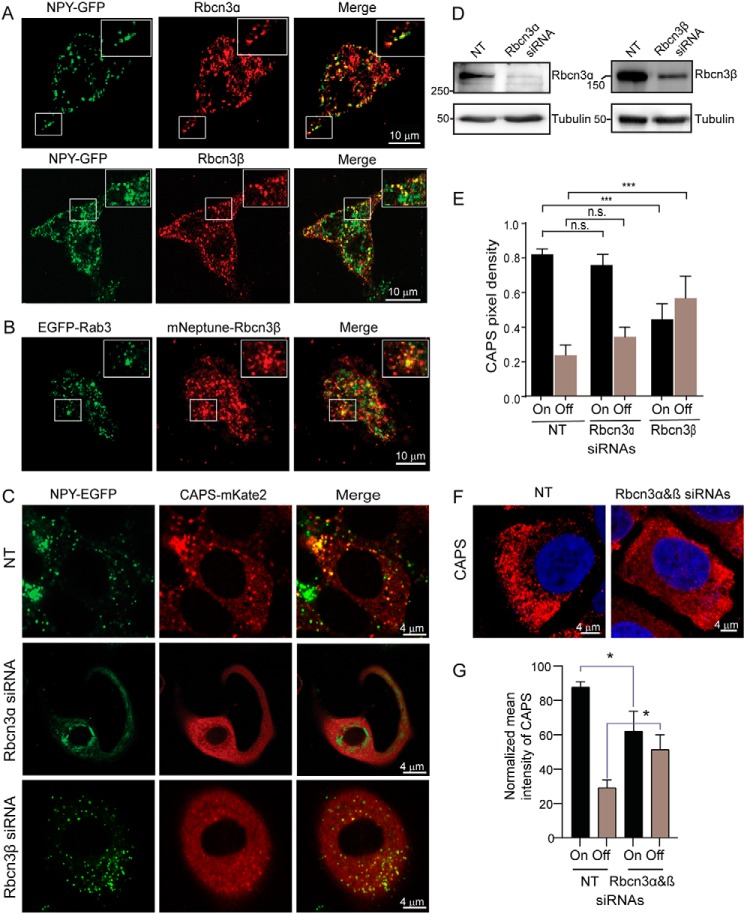
Figure 2.
Rbcn3β knockdown disrupts CAPS1 localization to DCVs. A, confocal images of BON cells stably expressing NPY-GFP as DCV cargo that were fixed for antibody staining for Rbcn3α (top) or Rbcn3β (bottom). Inset boxes show enlargements. Representative images from three experiments are shown. Colocalization of Rbcn3α and Rbcn3β with NPY-GFP–containing DCVs based on Pearson correlation coefficient was 0.67 ± 0.09 (n = 8) for Rbcn3α and 0.52 ± 0.02 (n = 8) for Rbcn3β. B, confocal image of BON cells expressing EGFP-Rab3 and mNeptune-Rbcn3β. Inset boxes show enlargements. Representative images from three experiments are shown. Colocalization based on Pearson correlation coefficient was 0.53 ± 0.07 (n = 4). C, representative confocal images of BON cells stably expressing NPY-GFP and CAPS1-mKate2 and transfected with NT, Rbcn3α, or Rbcn3β siRNA pools. Pearson correlation coefficients for NPY-GFP and CAPS1-mKate2 localization were 0.73 ± 0.01 for cells transfected with NT siRNA pools, 0.58 ± 0.04 for cells transfected with siRNA pools targeting Rbcn3α, and 0.35 ± 0.03 for cells transfected with siRNA pools targeting Rbcn3β (values are the mean ± S.E. of five different cells from three independent experiments). Comparison of NT with Rbcn3β knockdown was highly significant at p < 0.0005. D, siRNA pools reduced Rbcn3α by 85% and reduced Rbcn3β by 70% as normalized to tubulin. E, quantification of CAPS1 on DCVs (On) and cytosolic CAPS1 (Off) for cells transfected with NT, Rbcn3α, or Rbcn3β siRNA pools. Values shown represent mean ± S.E. of five different cells from three independent experiments. ***, p < 0.0005. F, representative images of CAPS1 immunofluorescence in cells treated with nontargeting siRNA pools or a combination of individual siRNAs that target Rbcn3α and Rbcn3β. G, quantification of CAPS1 on membrane (On) and cytosolic CAPS1 (Off). Values shown are mean ± S.E. (n = 3; *, p < 0.05). n.s., not significant.

