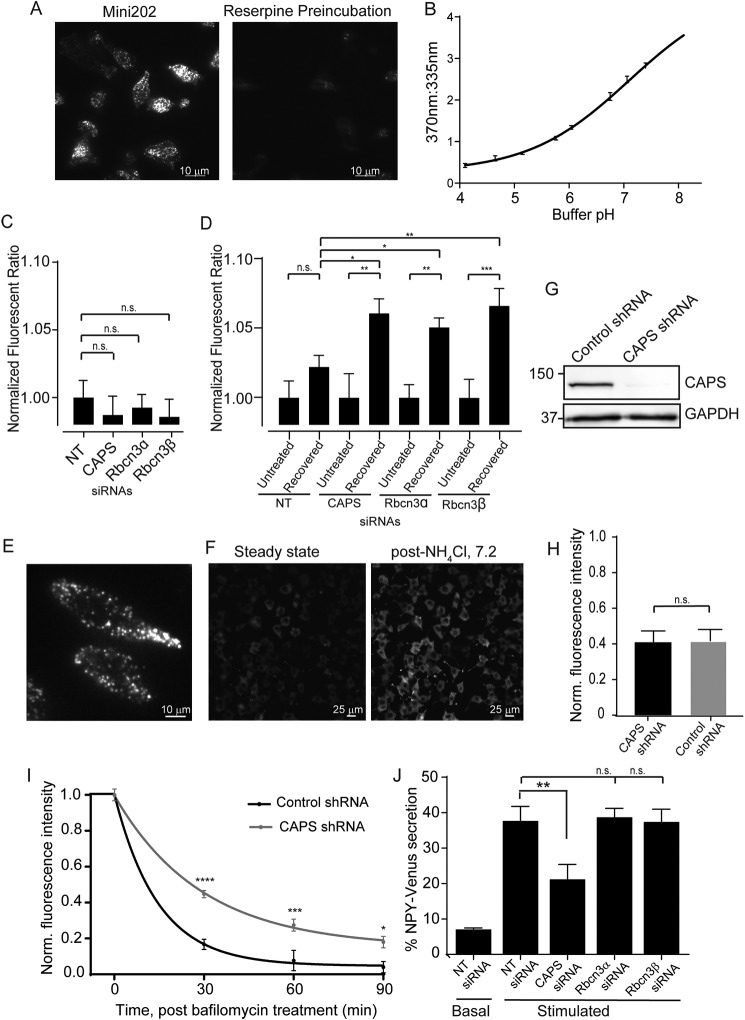
Figure 5.
CAPS and Rbcn3β knockdown cause acidification defects. A, TIRF image at 405-nm excitation of PC12 cells loaded with compound FFN202 (left). FFN202 loading is decreased if cells are preincubated with 1 μm reserpine, a VMAT blocker (right). B, the 370:355 nm emission ratio of FFN202 increases with increasing buffer pH. Values shown represent means ± S.E. (n = 3) read from a plate reader. C, 370:355 nm fluorescence ratio of FFN202-loaded PC12 cells transfected with CAPS1, Rbcn3α, or Rbcn3β siRNA pools normalized to determinations with a nontargeting siRNA pool. Values are the mean ± S.E. (n = 3, 10 replicates each), and differences were nonsignificant (n.s.). D, 370:335 ratios of PC12 cells either loaded with FFN202 (untreated) or preincubated with 100 nm bafilomycin prior to FFN202 loading (recovered). Bafilomycin-treated cells were normalized to untreated cells in each condition. Values represent the mean ± S.E. (n = 3, 10 replicates each). *, p < 0.05; **, p < 0.005; ***, p < 0.0005. E, TIRF image of PC12 cells expressing NPY-GFP. F, lower magnification epifluorescence images of PC12 cells expressing NPY-GFP before (left) and after (right) addition of 50 mm NH4Cl. G, Western blot showing CAPS1 depletion in stable lentivirus shRNA CAPS1 knockdown PC12 cells with GAPDH loading control. H, ratio of NPY-GFP fluorescence before and after NH4Cl addition in multiple (>900) control and CAPS1 knockdown cells. Mean values ± S.E. are shown for five experiments. I, ratio of NPY-GFP fluorescence (±NH4Cl) in control or CAPS1 knockdown PC12 cells over 90 min as cells recovered from 1-h treatment with 100 nm bafilomycin. Fluorescence ratios were normalized to 1.0 at zero time. Values shown are means ± S.E. for determinations in >100 cells for each condition. *, p < 0.05; **, p < 0.005; ****, p < 0.00005. J, basal and ionomycin-stimulated NPY-Venus secretion in 10 min from BON cells was determined following transfection of the indicated siRNA pools. Mean values ± S.E. are shown. **, p < 0.01 (n = 3).

