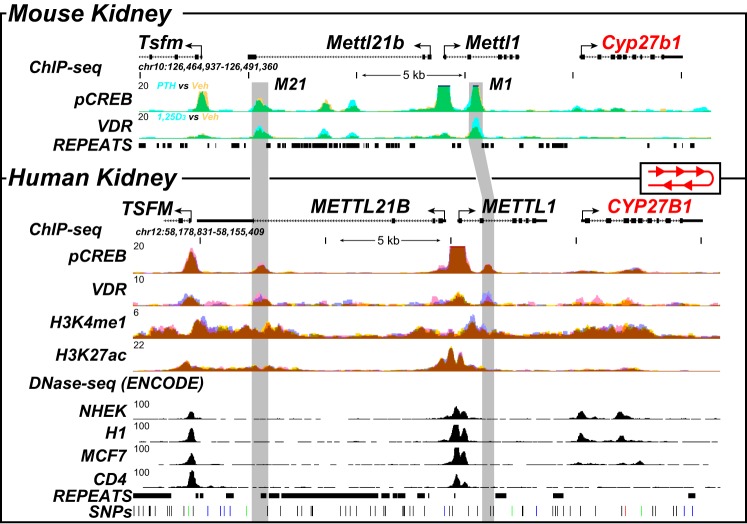
Figure 9.
ChIP-Seq analysis of the human kidney reveals conserved genomic occupancy relative to the mouse. ChIP-Seq analysis of the mouse kidney (13) (top, as in Fig. 1A) was contrasted with that derived from isolated human kidney cortex. Overlaid ChIP-Seq data tracks for pCREB and VDR from mouse kidney (top) are displayed as either basal or vehicle (yellow, n = 3) or treated for 1 h with PTH or 1,25(OH)2D3 (blue, n = 3) as indicated. Overlapping data (vehicle and treatment) appear as green. Bottom, human kidney ChIP-Seq data for pCREB, VDR, H3K4me1, and H3K27ac are displayed in triplicate (blue, yellow, and pink; overlaps appear as brown). DNase-Seq data from the ENCODE project (normal human embryonic kidney (NHEK), embryonic stem cell line H1, MCF7 breast cancer cells, CD4-positive T cell line) are shown to highlight specificity retained for adult kidney. Regions of interest are highlighted in light gray boxes. The human CYP27B1 locus is in the opposite direction on chromosome 12, and therefore, we reversed the human locus to highlight conservation of the peaks to the mouse. Genomic repeats and SNPs are also displayed aligned to the data at the bottom. Genomic location and scale are indicated (top), and maximum height of tag sequence density for each data track is indicated on the y axis (top left, each track, normalized to input and 107 tags). The direction of transcription is indicated by the arrow, and exons are indicated by boxes.

