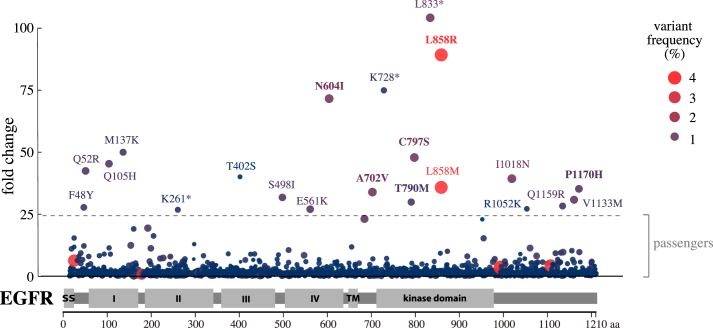
Figure 3.
Clonal selection of activating EGFR mutations. The scatter blot demonstrates the enrichment of few specific EGFR mutations in Ba/F3 cells engineered to express 7,216 EGFR variants and to grow in an EGFR activity–dependent manner. The y axis indicates the -fold change of the variant frequency after growing the cells for 2 weeks when compared with the variant frequency in the original mutation library used to transduce the cells. The x axis indicates the position of the mutated residue on the EGFR primary sequence. The size of the dot as well as the intensity of its red color indicate the relative variant frequency of the mutation in the growing cell pool at the 2-week time point. The dashed horizontal line indicates the -fold change level (24.5) for statistically significant difference from the normal distribution after log2 transformation (q < 0.0001).

