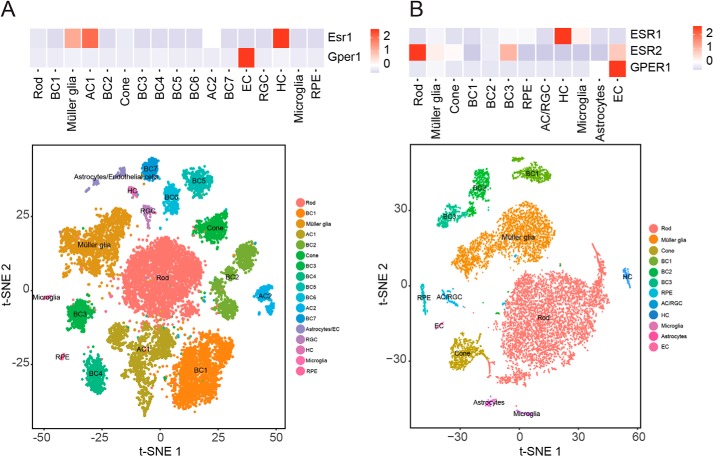
Figure 8.
scRNA-Seq analysis of ER expression in mouse and human retinas. Heat maps show the correlation between the expressions of ER genes in different cell clusters from adult mouse (A) and human whole retina (B) at the single-cell level. AC, amacrine cells; BC, bipolar cells; HC, horizontal cells; RGC, retinal ganglion cells; EC, endothelial cells. The color intensity in the heat map is based on the expression levels of ER genes in the retina.

