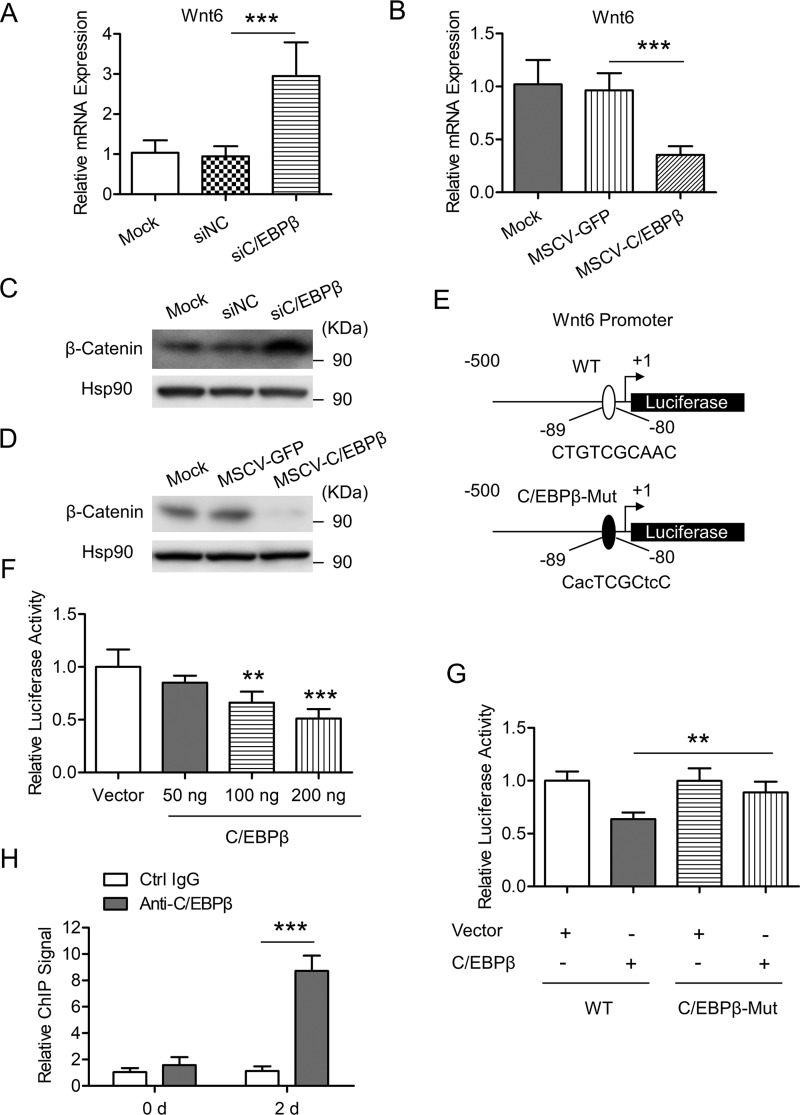
Figure 5.
C/EBPβ inhibits Wnt6 transcription through binding to its promoter. A, 3T3-L1 preadipocyte was transfected with the indicated siRNAs and induced to differentiation. Cells were harvested on day 2 after adipogenic induction. The mRNA level of Wnt6 was determined by RT-qPCR. Data were normalized to the mock group. B, 3T3-L1 preadipocyte was infected with retrovirus expressing GFP or C/EBPβ and induced to differentiation. Cells were harvested on day 2 after adipogenic induction. The mRNA level of Wnt6 was determined by RT-qPCR. Data were normalized to the mock group. C, cells were treated as in A, and then the indicated proteins were detected by Western blotting. Hsp90 is the loading control. D, cells were treated as in B, and then the indicated proteins were detected by Western blotting. Hsp90 is the loading control. E, schematic representation of Wnt6 proximal promoter constructs used for luciferase assays. The predicted consensus of C/EBP binding site is shown in the WT luciferase construct. The lowercase letters indicate mutations of the C/EBP binding site in the C/EBPβ-Mut construct. F, 3T3-L1 preadipocyte was transiently transfected with a WT reporter construct as shown in E, along with different amounts of C/EBPβ expression vector, and pRL-TK plasmid was used as an internal control; cell extracts were prepared, and luciferase activities were measured and normalized to Renilla activity. Data were then normalized to the vector group. G, 3T3-L1 preadipocyte was transiently transfected with WT or C/EBPβ-Mut reporter construct as shown in E, along with control vector or C/EBPβ expression vector, and pRL-TK plasmid was used as an internal control. Luciferase activities were measured as in F. H, enrichment of C/EBPβ on Wnt6 proximal promoter was analyzed by ChIP-qPCR. 3T3-L1 cells were induced to differentiation. At the times indicated, ChIP-qPCR was performed by using control IgG and anti-C/EBPβ antibody. Data were normalized to the IgG controls at each time point. All values are represented as means with error bars representing S.D. *, p < 0.05; **, p < 0.01; ***, p < 0.001. For statistical analysis, one-way analysis of variance and Bonferroni's post hoc tests were carried out in A, B, and F (compared with vector) and G, and two-way analysis of variance and Bonferroni's post hoc tests were performed in H.

