. 2019 Jun 17;8:e47677. doi: 10.7554/eLife.47677

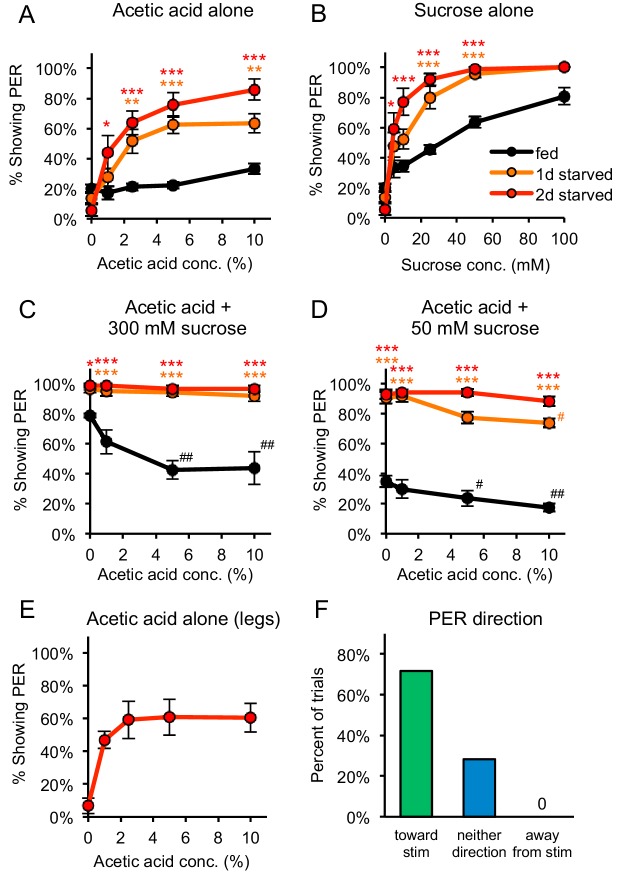
Figure 1. Acetic acid induces aversive or appetitive taste responses depending on hunger state.

(A) One-day or two-day starved flies, but not fed flies, showed strong PER to acetic acid applied to the labellum. PER at 0% acetic acid represents the baseline response to water. (B) Both fed and starved flies showed dose-dependent PER to sucrose applied to the labellum. (C) Acetic acid suppressed PER to 300 mM sucrose in fed flies but not in one-day or two-day starved flies. (D) Acetic acid suppressed PER to 50 mM sucrose in fed flies and had a small but significant effect in one-day starved flies, but not in two-day starved flies. (E) Two-day starved flies showed PER to acetic acid applied to the legs. (F) Two-day starved flies stimulated asymmetrically with 5% acetic acid on the legs tended to show PER toward the stimulus (n = 53 trials, nine flies). In panels A-D, fed and starved flies were compared using two-way repeated measures ANOVA followed by Bonferroni’s post-tests (*p<0.05, **p<0.01, ***p<0.001; orange or red asterisks correspond to one- or two-day starved flies, respectively). In panels C-D, responses within each group were compared to the response to 0% acetic acid using one-way repeated-measures ANOVA followed by Dunnett's post-tests (#p<0.05, ##p<0.01; symbols colored by group). Detailed statistical results for all experiments are reported in Supplementary file 1. For panels A-E, n = 3–5 sets of flies. See also Figure 1—figure supplements 13 and Videos 1 and 2.

Figure 1—source data 1. Raw data for Figure 1.
DOI: 10.7554/eLife.47677.007

Figure 1.

Figure 1—figure supplement 1. At low sucrose concentrations acetic acid enhances sucrose-evoked PER in two-day starved flies.
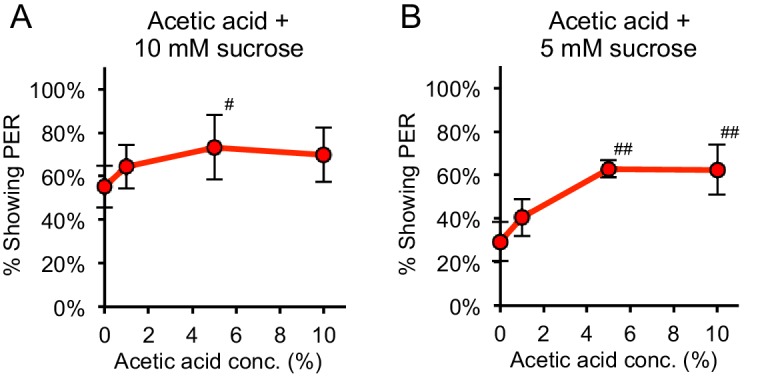
Figure 1—figure supplement 1.

(A–B) When acetic acid was added to low concentrations of sucrose (10 mM in panel A and 5 mM in panel B), acetic acid enhanced sucrose-evoked PER in two-day starved flies (#p<0.05, ##p<0.01, one-way repeated-measures ANOVA followed by Dunnett's post-tests comparing responses to 0% acetic acid to responses to other concentrations). n = 4 sets of flies.
Figure 1—figure supplement 2. Starved flies show aversion to bitter compounds.

Figure 1—figure supplement 2.

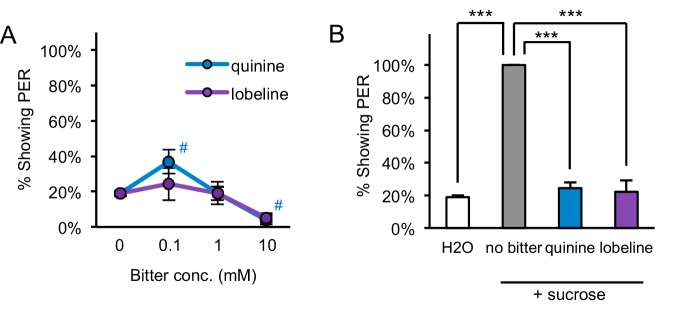
(A) Two-day starved flies did not show consistent or strong PER to the bitter compounds quinine or lobeline (#p<0.05, one-way repeated measures ANOVA followed by Dunnett's post-tests comparing bitter stimuli to water; symbols colored by group). (B) Two-day starved flies showed aversion to bitter compounds, since the addition of 10 mM quinine or 5 mM lobeline suppressed PER to 50 mM sucrose (***p<0.001, one-way repeated measures ANOVA followed by Bonferroni's post-tests). n = 5 sets of flies.
Figure 1—figure supplement 3. PER to other acids and acetate in starved flies.

Figure 1—figure supplement 3.

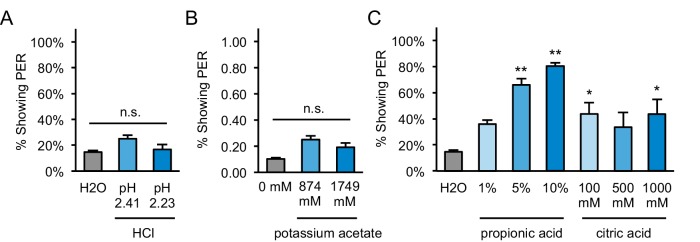
(A) Two-day starved flies did not show significant PER to hydrochloric acid (HCl) solutions prepared at the same pH values as measured for 5% and 10% acetic acid (pH 2.41 and 2.23 respectively). (B) Two-day starved flies did not show significant PER to potassium acetate presented at the same molarities as 5% and 10% acetic acid (874 and 1749 mM, respectively). (C) Two-day starved flies showed moderate to strong PER to propionic and citric acid. For all panels: *p<0.05, **p<0.01, one-way repeated measures ANOVA followed by Dunnett's post-tests comparing each tastant to water. n = 4 sets of flies.