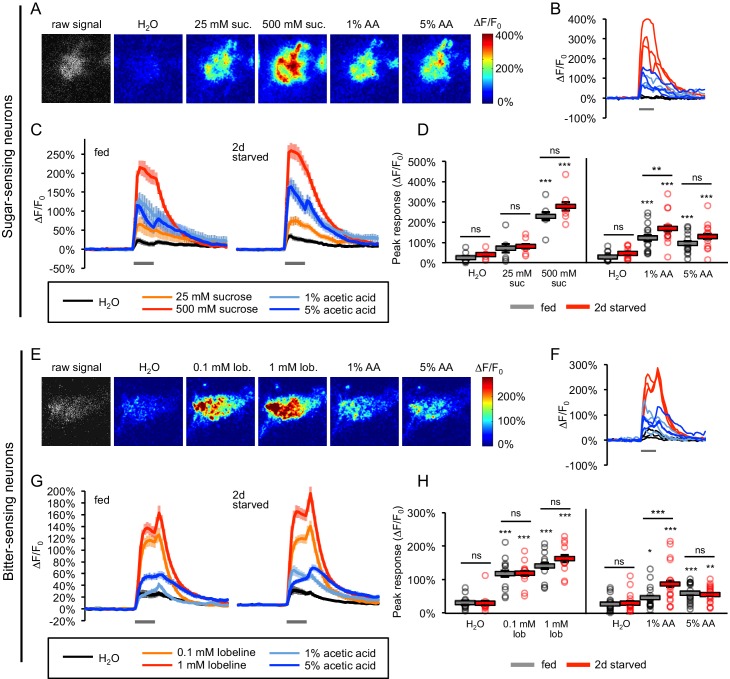
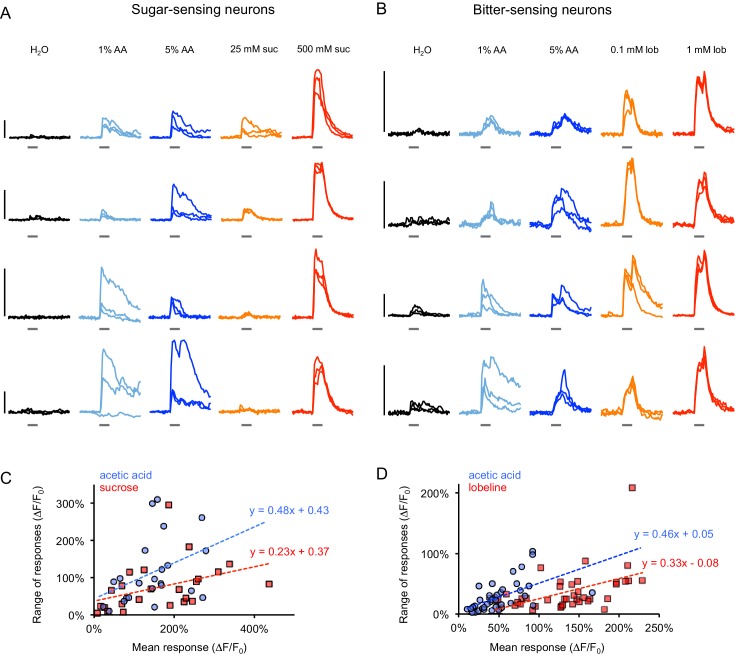
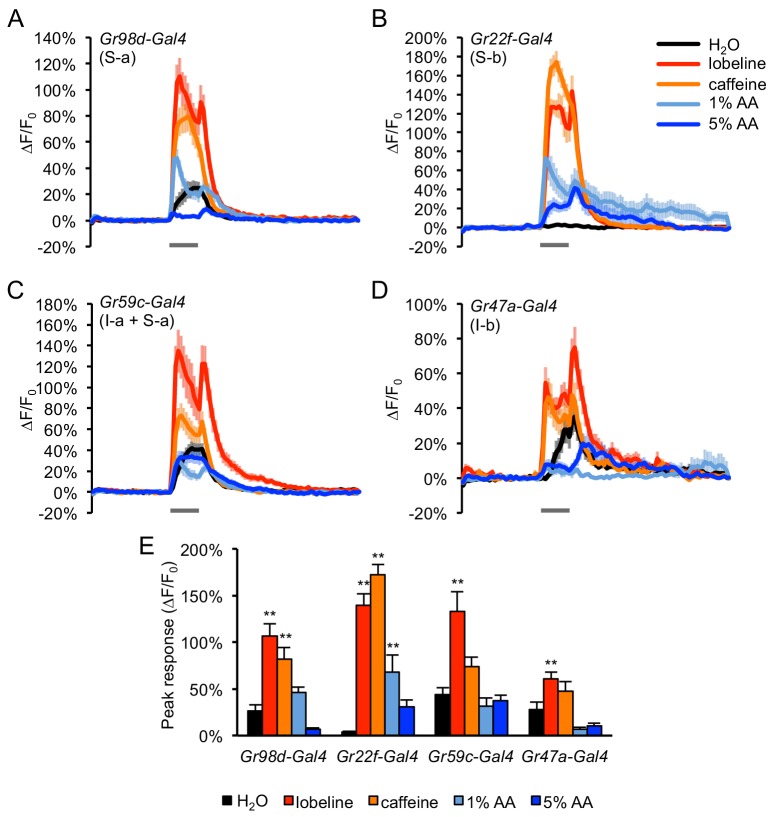
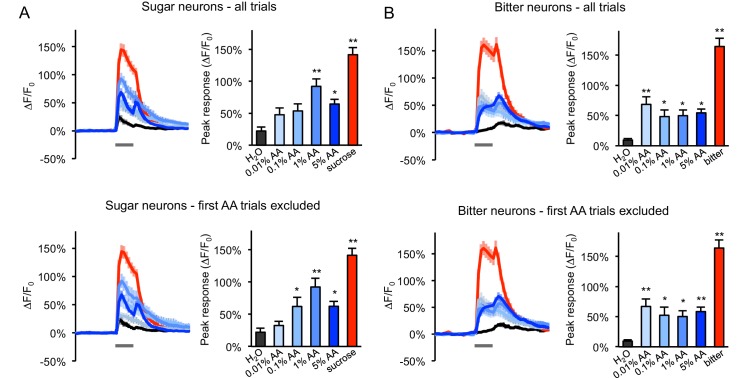
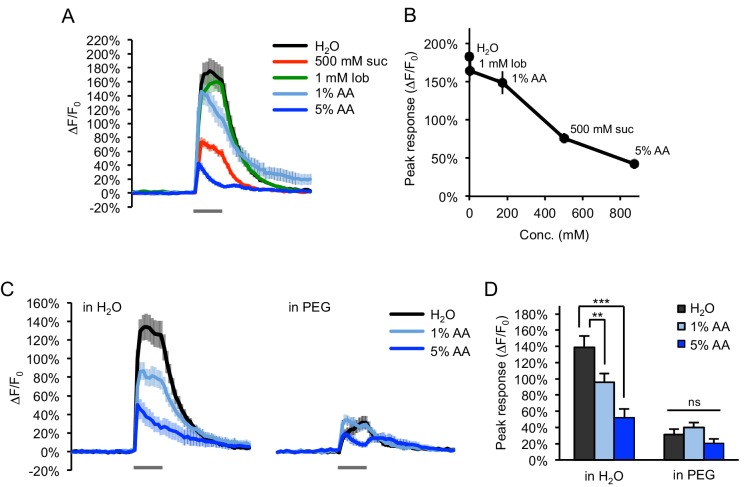
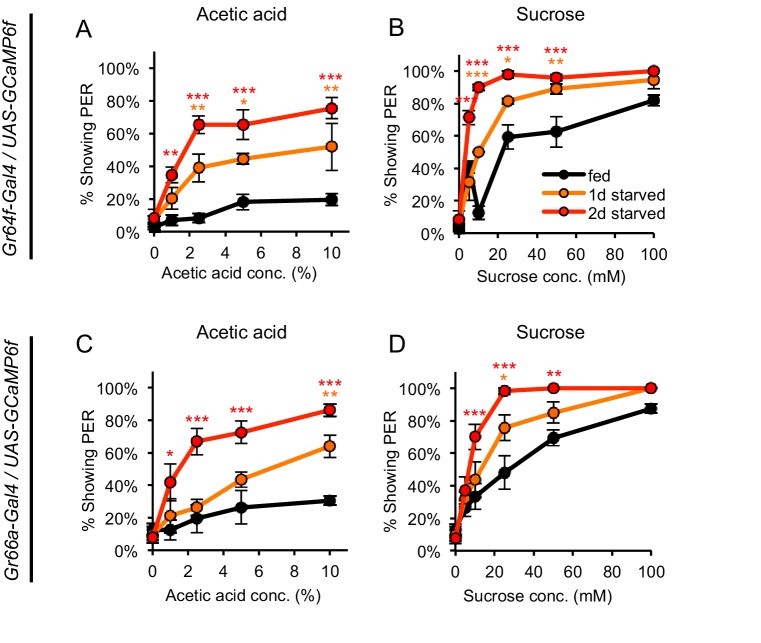
Figure 5. Acetic acid activates sugar- and bitter-sensing neurons.
(A–H) Calcium imaging of taste sensory neurons reveals that acetic acid (AA) activates sugar-sensing neurons (labeled with Gr64f-Gal4; panels A-D) and bitter-sensing neurons (labeled with Gr66a-Gal4; panels E-H) in both fed and two-day starved flies. (A, E) Spatial maps of GCaMP activation by each stimulus for individual flies (A, fed; E, starved). (B, F) Example ∆F/F0 traces for individual trials in the same flies shown in A and E, respectively. (C, G) Average GCaMP activation across all trials in all flies of each group. Gray bars indicate stimulus delivery (2 s). (D, H) Peak response to each stimulus averaged across all trials for each group. Circles represent individual fly averages. Within each group, responses to each stimulus were compared to responses to water, and fed and starved groups were also compared for each stimulus (*p<0.05, **p<0.01, ***p<0.001, two-way ANOVA followed by Bonferroni post-tests). Data shown in this figure represent n = 15–19 trials, six flies per group (sugar neurons, sucrose stimuli), n = 39–43 trials, 14 flies per group (sugar neurons, AA stimuli), n = 30 trials, 10 flies per group (bitter neurons, lobeline stimuli), or n = 54 trials, 18 flies (bitter neurons, AA stimuli). n values are larger for AA stimuli because we combined the results of two different datasets, but only the more recent dataset included the appropriate sucrose and lobeline stimuli. Only the more recent dataset is shown in panels C and G, whereas peak responses to AA stimuli for the combined dataset are analyzed in panels D and H. See also Figure 5—figure supplements 1–7.

