. 2019 Jun 3;8:e48186. doi: 10.7554/eLife.48186

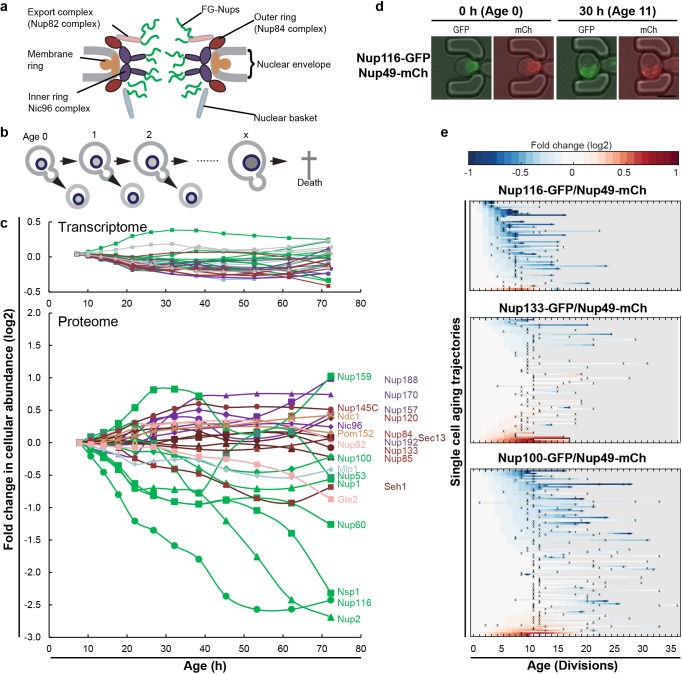
Figure 1. The cellular abundance of some NPC components changes in replicative aging.

(a) Cartoon representation of the NPC illustrates different structural regions of the NPC, all FG-Nups are shown in green independently of their localization, the membrane rings in light brown, the inner rings in purple, the outer rings in brown, the mRNA export complex in pink, and the nuclear basket structure in light blue. Adapted with permission from Springer Nature Customer Service Centre GmbH: Springer Nature, Nature, Integrative structure and functional anatomy of a nuclear pore complex, Kim et al. (2018). (b) Schematic presentation of replicative aging yeast cells. (c) Transcript and protein abundance of NPC components (color coded as in Figure 1a) as measured in whole cell extracts of yeast cells of increasing replicative age; after 68 hr of cultivation the average replicative age of the cells is 24. Cells were aged under controlled and constant conditions (Janssens et al., 2015). See also Figure 1—figure supplement 1a. (d) Young cells are trapped in the microfluidic device and bright field images are taken every 20 min to define the cells age and fluorescent images are taken once every 15 hr to detect the protein localization and abundance. Representative images of cells expressing indicated fluorescent protein fusions imaged at the start of the experiment and after 30 hr; their replicative age is indicated. Scale bar represents 5 µm. (e) Heat map representation of the changes in the levels of the indicated GFP- and mCh-tagged Nups at the NE in each yeast cell at increasing age. Each line represents a single cell’s life history showing the change in the ratio of the fluorescence from the GFP-tagged Nup over the fluorescence from the mCh-tagged Nup and normalized to their ratio at time zero. Measurement of the fluorescence ratios are marked with ‘x’; in between two measurements the data was linearly interpolated. The fold changes are color coded on a log 2 scale from −1 to + 1; blue colors indicate decreasing levels of the GFP-fusion relative to mCh. Number of cells in the heatmaps are Nup116-GFP/Nup49-mCh = 67, Nup133-GFP/Nup49-mCh = 94 and Nup100-GFP/Nup49-mCh = 126.

© 2018 Springer Nature

Figure 1A adapted with permission from Kim et al. (2018).

Figure 1.

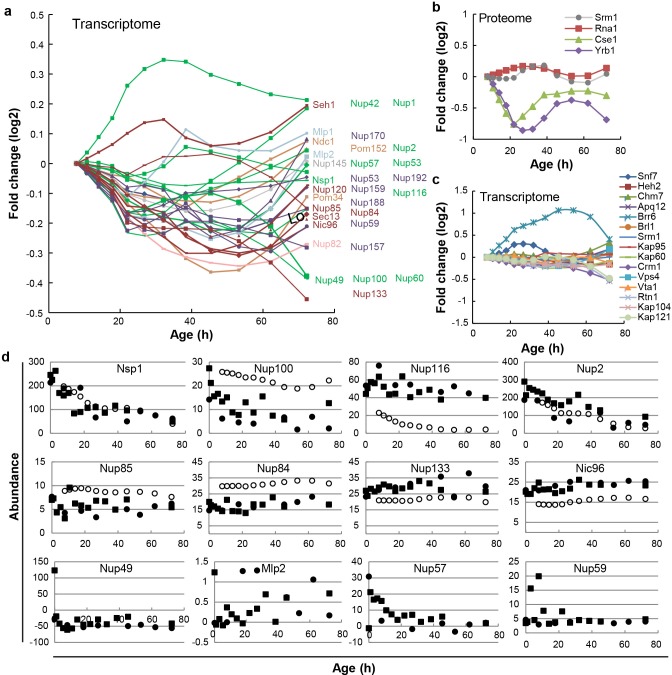
Figure 1—figure supplement 1. Cellular protein and mRNA abundance of Nups, NTRs and assembly factors in replicative aging.

Figure 1—figure supplement 1.

(a) mRNA abundance of NPC components in replicative aging; a zoom-in of Figure 1A. Changes in abundance are plotted as fold change. Replicative age increases in time. Transcriptome data from Janssens et al. (2015). (b) Protein abundance of the RanGEF Srm1, the RanGap Rna1, the RanBP1 Yrb1, and the transport receptor Cse1 as measured in whole cell extracts of yeast cells of increasing replicative age. Data from Janssens et al. (2015). (c) mRNA abundance of NPC assembly components and NTRs tested in this study in replicative aging. Changes in abundance are plotted as fold change. Replicative age increases in time. Transcriptome data from Janssens et al. (2015). (d) Protein abundances of Nups in extracts of aging yeast cells after first two data processing steps (black squares and circles from two biological replicates) and after final data processing (white circles) (data from Janssens et al., 2015). Black squares and circles represent the abundances of Nups in whole cell extracts of mixed cell samples enriched for replicative aging mother cells (referred to as mix two in Janssens et al., 2015) after the first two data processing steps. These first two data processing steps involve the normalization of the raw abundances to 1 million and the protein-specific correction for bead-related protein losses. The open circles reflect abundances of the Nups after the additional data processing steps of the deconvolution of the mother-cell-specific abundances. Nup49, Mlp2, Nup57 and Nup59 (bottom row) were missing in the final datasets reported in Janssens et al. (2015) as the third data processing step failed. For Nup49 specifically the problem was that the protein specific correction for bead related protein losses yielded negative values as the losses were estimated too high.

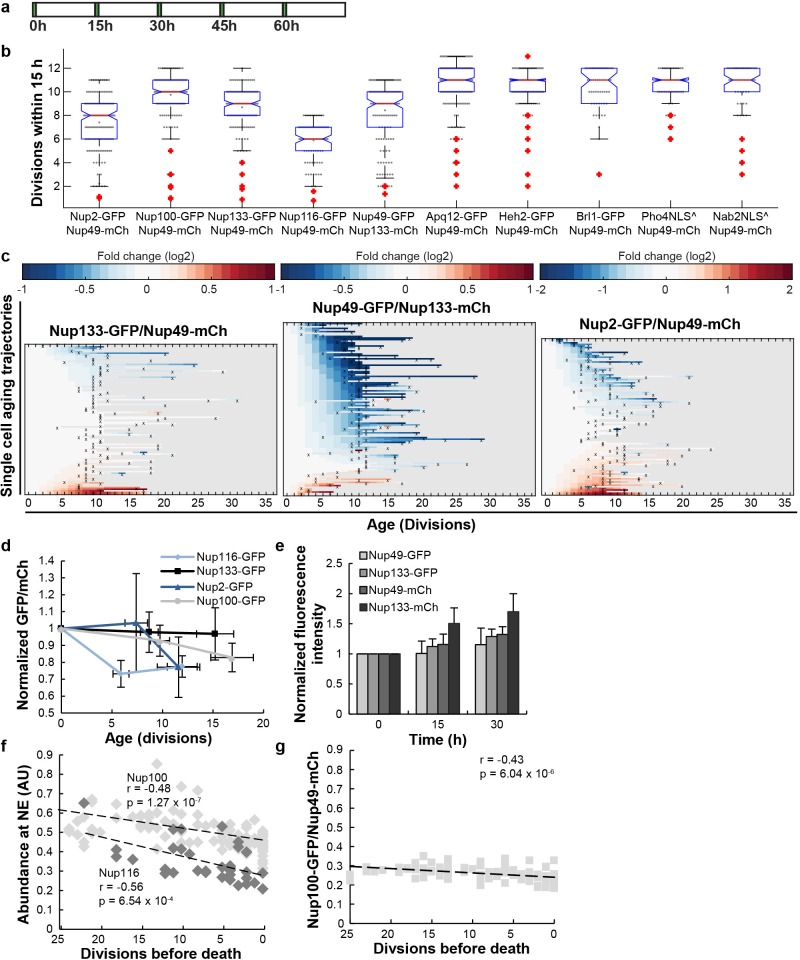
Figure 1—figure supplement 2. The abundance and localization of NPC components in replicative aging.

Figure 1—figure supplement 2.

(a) The experimental timeline where young cells are trapped in the microfluidic device and bright-field images are taken every 20 min to define the cell’s age and fluorescent images are taken once every 15 hr to detect the protein localization and abundance. (b) The median number of completed divisions during the first 15 hr in the microfluidic chip of different strains used in this study and grown on glucose. Please see Figure 4—figure supplement 3 for three strains grown on galactose. ^ Pho4NLS and Nab2NLS are reporter strains, where the NLS is fused to a GFP under the control of the conditional TPI1 promotor. The tagging of Nups with GFP reduces the fitness of the cells to various extends. (c) Heat map representation of the changes in the levels of the indicated GFP- and mCh-tagged Nups at the NE in each yeast cell at increasing age. Each line represents a single cell’s life history showing the change in the ratio of the fluorescence from the GFP-tagged Nup over the fluorescence from the mCh-tagged Nup and normalized to their ratio at time zero. Measurement of the fluorescence ratios are marked with ‘x’; in between two measurements, the data was linearly interpolated. The fold changes are color coded on a log 2 scale from −1 to + 1, except for Nup2 where the changes were larger and the scale runs from −2 to 2; blue colors indicate decreasing levels of the GFP-fusion relative to mCh. Number of cells in the heatmaps are Nup133-GFP/Nup49-mCh = 94, Nup49-GFP/Nup133-mCh = 108, Nup2-GFP/Nup49-mCh = 98. Data from Nup133-GFP/Nup49-mCh is repeated from Figure 1b middle panel for easy comparison with the tag-swapped strain Nup49-GFP/Nup133-mCh and illustration of the systematic changes in the fluorescence from GFP and mCh in aging; see also panel e. (d) Normalized GFP/Nup49-mCh ratio representing the average from cells shown in panel b and Figure 1e. The indicated age is the average number of divisions at time points 0 hr, 15 hr, 30 hr. Error bars are SD of the mean. For Nup116-GFP the change in abundance becomes significant after 15 hr, with p<0.001. For Nup2-GFP and Nup100-GFP the change in abundance is significant with p<0.005 after 30 hr. The number of all measurements contributing to the means (N) at the time points 0 hr, 15 hr and 30 hr were for Nup116 = 76, 70 and 32; for Nup100 = 139, 137 and 86; for Nup2 = 112, 116 and 58; and for Nup133 = 102, 109 and 45, respectively. (e) The average fluorescence intensities from GFP and mCh in Nup133-GFP/Nup49-mCh and the tag-swapped strain Nup49-GFP/Nup133-mCh increase in time during replicative aging experiments, but more so for mCh than for GFP. The systematic changes in the fluorescence from GFP and mCh in aging is likely caused by differences in the maturation times of both fluorophores and/or their pH sensitivity. For the strain expressing Nup49-GFP and Nup133-mCh, N = 113, 104 and 50, and for the strains expressing Nup133-GFP and Nup49-mCh, N = 102, 85 and 27 at time points 0 hr, 15 hr and 30 hr, respectively. Error bars are SD of the mean. (f) The abundance of Nup116-GFP (gray) and Nup100 (black) at the NE relative to Nup49-mCh as a function of remaining lifespan. The dotted lines indicate the best linear fit. Total number of cells analysed are Nup116 = 15 and Nup100 = 35 and the total number of measurements are Nup116 = 34 and Nup100 = 108. (g) Additional independent replicate (coming from a different microscope) for Nup100-GFP/Nup49-mCh abundance correlation to lifespan. The cells in f and g were imaged with different filter settings explaining the different ratios. Number of cells analysed are N = 62 and number of measurements are N = 101.

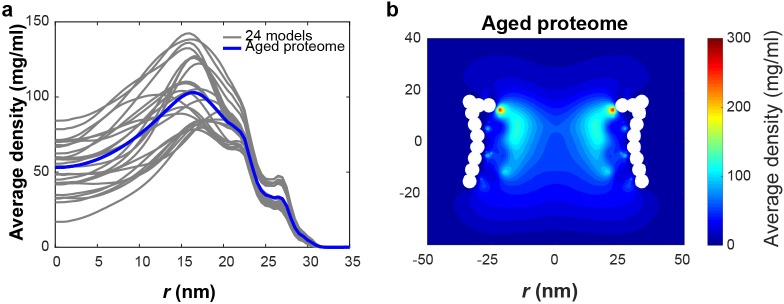
Figure 1—figure supplement 3. Models of NPCs with altered stoichiometry.

Figure 1—figure supplement 3.

(a) The time averaged radial density distribution of the 24 constructed models (gray) (see Table 1) based on the FG-Nup abundance data from Figure 1c with the average of the 24 models plotted in blue denoted as ‘Aged proteome’. Each curve in gray represents the radial density averaged over the NPC height that is |z| < 15.4 nm for one of the 24 different models. (b) Time-averaged r-z density of FG-Nups in the ‘Aged proteome’ NPC. .