
Figure 4. Increased steady state nuclear compartmentalization in aging is mimicked in NPC assembly mutants.
(a) Heatmaps showing single-cell changes in localization (N/C ratios) of GFP (N = 49), GFP-NES (N = 75) and GFP-NLS (N = 66) reporter proteins during replicative aging. (b) N/C ratios of GFP-tcNLS, GFP-NES and GFP as the cells age. The line indicates the median, and the bottom and top edges of the box indicate the 25th and 75th percentiles, respectively. The whiskers extend to the data points, which are closest to 1.5 times above below the inter quartile range, data points above or below this region are plotted individually. Non-overlapping notches indicate that the samples are different with 95% confidence. The number of cells analyzed are GFP = 54, 51, 34; GFP-NLS = 74, 48, 57 and GFP-NES = 75, 41, 66 at time points 0 hr, 15 hr and 30 hr, respectively. (c) Heatmaps showing single-cell changes in localization (N/C ratios) of Nab2NLS-GFP (N = 53) and Pho4NLS-GFP (N = 56) reporter proteins during replicative aging. (d) Median N/C ratios of Nab2NLS-GFP and Pho4NLS-GFP as the cells age. The number of cells analyzed are Nab2NLS-GFP = 55, 52, 29 and Pho4NLS-GFP = 59, 58, 33 at time points 0 hr, 15 hr and 30 hr, respectively. (e) Deletion of apq12 increases nuclear compartmentalization of GFP-NLS and GFP-NES. The number of cells analyzed are GFP-NLS = 42, 48 and GFP-NES = 39, 34 for WT and Δapq12, respectively (f) Increased nuclear compartmentalization of GFP-NLS during early aging (10 hr of aging, median age of 2 divisions) in a Δvps4Δheh2 background. The number of cells analysed are 42 and 33, respectively. (g) Heatmap showing single-cell changes in localization (N/C ratios) of Srm1-GFP (N = 85) during replicative aging. (h) N/C ratios of Srm1-GFP increases as cells age. Numbers of cells analysed are N = 103, 125, 77 at time points 0 hr, 15 hr and 30 hr, respectively.

Figure 4—figure supplement 1. Efflux rate constants in aging.

Figure 4—figure supplement 2. The abundance of transport factors and NTR cargos does not change in aging.

Figure 4—figure supplement 3. Replicative lifespan curves.
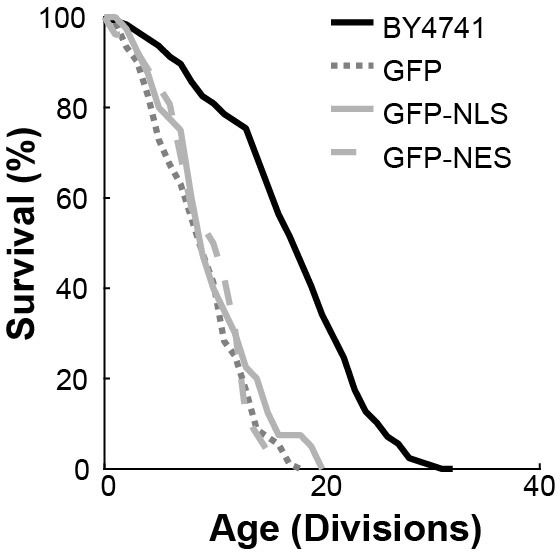
Figure 4—figure supplement 4. Apq12 is an essential gene in BY4741, but not in W303.
