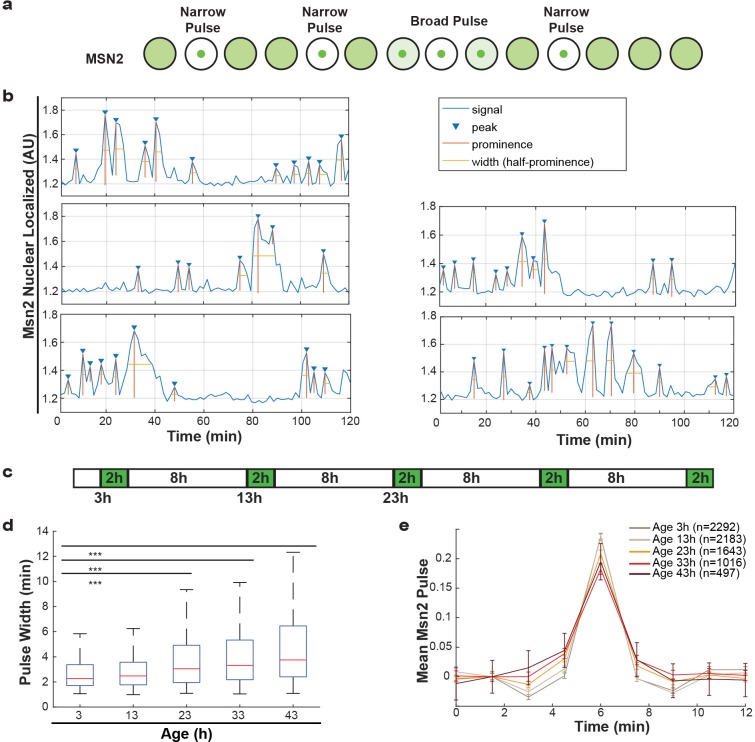
Figure 5. Alterations of nuclear envelope permeability during aging affects transcription factor dynamics.
(a) Schematic showing pulses of Msn2 translocation to the nucleus and movement back to the cytoplasm. (b) Five randomly selected single cell traces showing Msn2 dynamics. Low values indicate the majority of Msn2 is cytoplasmic, and high values indicate the majority of Msn2 is nuclear localized. Pulses are annotated showing peaks, prominence and the width of the pulse. (c) Experimental protocol for the aging experiment. White boxes indicate brightfield imaging only, and green boxes indicate fluorescence imaging. (d) As cells age, the width of the Msn2 pulses increases reliably. (*** indicates p<0.0001 two-tailed t-test). (e) Msn2 pulses were identified at each age, and then all pulses were averaged together at each age. To correct for changes in baseline localization with age, the mean pre-pulse level was subtracted at each age. Error bars are standard error.
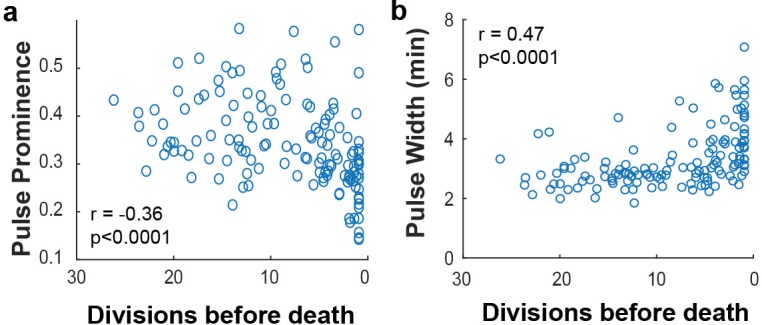
Figure 5—figure supplement 1. Msn2 pulse prominence and width correlate to remaining lifespan.


