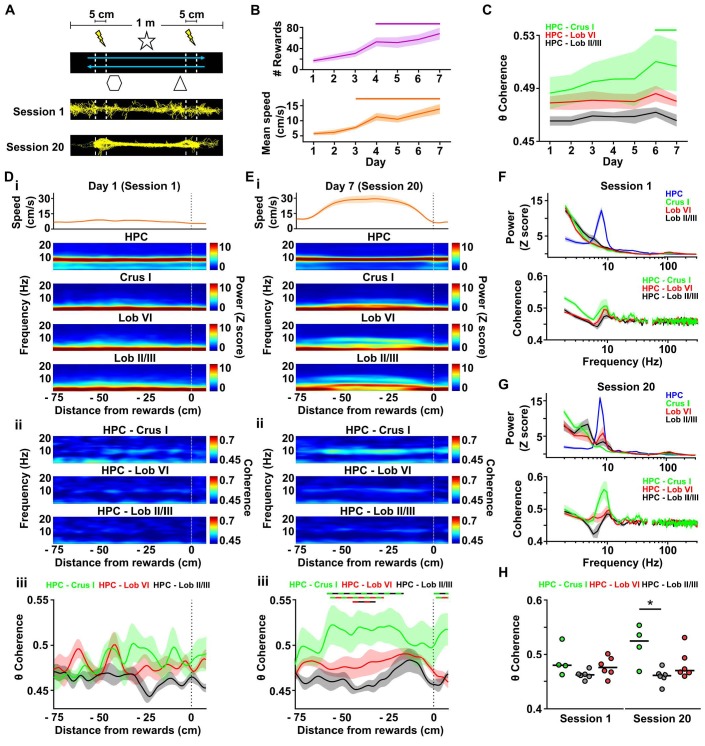
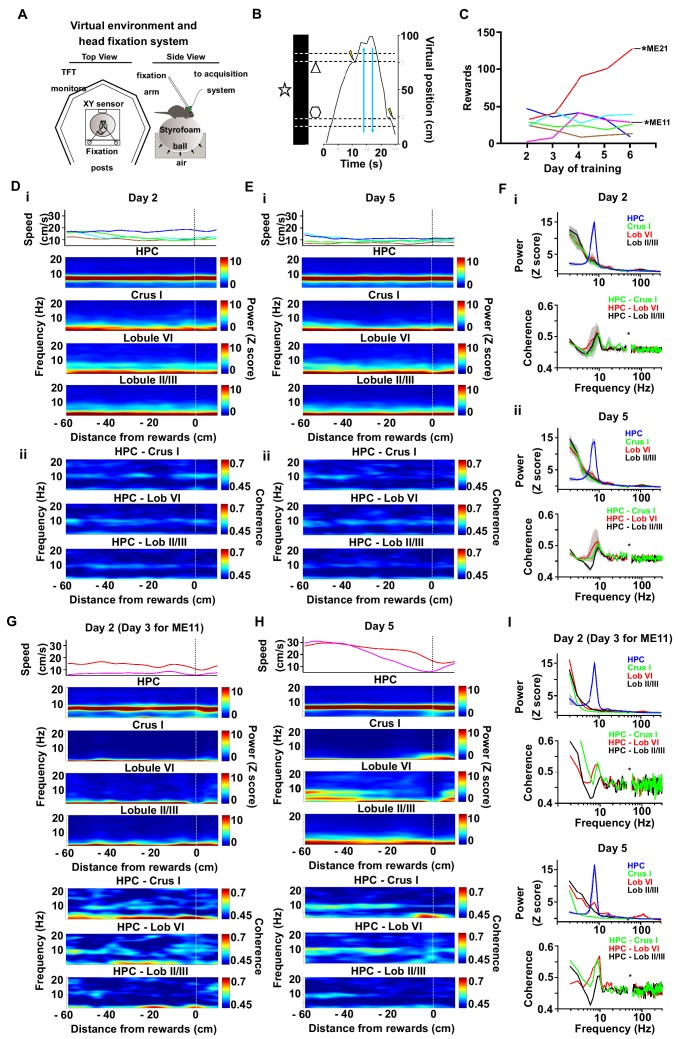
Figure 4. Cerebello-hippocampal interactions during goal-directed behavior.
(A) Mice learned to traverse a 1 m linear track to receive a medial forebrain bundle stimulation (lightening symbols) upon reaching invisible goal zones (n = 8 mice). Representative trajectories from early (session 1) and late (session 20) training show the transition from exploratory to goal-directed behavior. (B) Mice improved their performance in the task across days as shown by increases in the mean number of rewards obtained (average of the three sessions per day, repeated measures Friedman test with FDR correction, Friedman statistic = 37.91, p < 0.0001; solid line, day 1 vs days 4–7, p < 0.01) and mean speed (average of the three sessions per day, repeated measures Friedman test with FDR correction, Friedman statistic = 36.32, p < 0.0001; solid line, day 1 vs days 4–7, p < 0.05). (C) Overall cerebello-hippocampal theta coherence per day (average of the three sessions per day) during learning of the linear track task (when both hippocampal recording electrodes were on target we averaged the coherence obtained with left and right hemispheres; Crus I, n = 4; lobule II/III, n = 6; lobule VI, n = 6). Hippocampus-Crus I coherence increased significantly compared with first day (day of training x cerebello-hippocampal combination two-way ANOVA with FDR correction, day effect F6,84 = 3.873, p = 0.0018; solid line, day 1 vs days 6–7, p < 0.01). (D) i, Top: Mean speed aligned by distance from the reward location (position 0) averaged across runs during session 1. Bottom: Mean power spectrogram aligned by distance from reward and averaged across runs during session one for hippocampus LFP (n = 8, mean between left and right hemisphere LFPs when both hippocampal recordings were on target) and cerebellar cortical regions (Crus I, n = 4; lobule II/III, n = 6; lobule VI, n = 6). ii, Mean coherogram aligned by distance from reward location (position 0) averaged across runs during session one for each hippocampal-cerebellar combination (when both hippocampal recording electrodes were on target we averaged the coherence obtained with left and right; Crus I, n = 4; lobule II/III, n = 6; lobule VI, n = 6). iii, Mean theta coherence aligned by distance from reward and averaged across runs during session one for each hippocampal-cerebellar combination (mean between coherence with left and right hemisphere LFPs when both recordings were on target; Crus I, n = 4; lobule II/III, n = 6; lobule VI, n = 6). No significant differences between hippocampal-cerebellar combination or distances from reward were observed, but a significant interaction effect was obtained (distance x combination two-ways repeated measures ANOVA with FDR correction; combination effect, F2,13 = 2.33, p = 0.1365; distance effect, F84,1092 = 1.043, p = 0.3772; interaction effect, F168,1092 = 1.332, p = 0.0053). (E) Same as D for session 20. Significant differences were observed between hippocampal-cerebellar combinations (distance x combination two-ways repeated measures ANOVA with FDR correction; combination effect, F2,13 = 6.145, p = 0.0132; distance effect, F84,1092 = 1.682, p = 0.0002; interaction effect, F168,1092 = 1.271, p = 0.0163). Post-hoc analysis revealed sustained (at least for five consecutive cm) differences between Crus I-HPC and lobule II/III-HPC coherence at distances from −60 to −20 cm from reward (solid green/black line), between lobule VI-HPC and lobule II/III-HPC coherence between −44 and −31 cm from reward (solid red/black line) and also between Crus I-HPC and lobule VI-HPC coherence between −59 and −36 cm from reward (solid green/red line). (F) Top: Averaged LFP power between −60 and −20 cm from reward (session 1). Bottom: Averaged coherence between −60 and −20 cm from reward (session 1). The spurious peak in the 49–51 Hz band generated for the electrical noise has been removed. (G) Same as J for session 20. (H) Averaged theta coherence between −60 and −20 cm from reward between cerebellar recordings and hippocampus during session 1 (left) and session 20 (right, coherence averaged between left and right hemisphere LFPs when both hippocampal recording electrodes were on target; Crus I, n = 4; lobule II/III, n = 6; lobule VI, n = 6). Crus I-HPC coherence was significantly higher than that observed with lobule II/III in the session 20 (*, Kruskal-Wallis with FDR correction, Kruskal-Wallis statistic = 7.989, p = 0.0103; Crus I-HPC vs lobule II/III-HPC, p = 0.0110).

