. 2019 May 13;8:e45403. doi: 10.7554/eLife.45403

Figure 7. Biochemical characterization of gain-of-function mutations revealed by conformational landscapes of SETD8.

(a) Fluorescence changes of wild-type and K382P SETD8 traced with a rapid-quenching stopped-flow instrument within 1 s upon SAM binding. (b) Stepwise SAM-binding of SETD8 in the integrative context of biochemical, biophysical, structural, and simulation data. ITC determines the thermodynamic constant of SAM binding by SETD8. MD simulations and MSM uncover metastable conformations and interconversion rates of apo- and SAM-bound SETD8 (Kapo and KSAM). Stopped-flow experiments revealed that SETD8 binds SAM via biphasic kinetics. Rate constants uncovered by stopped-flow experiments (k1, k-1, k2, k-2) represent macroscopic rates of SAM binding by SETD8 with multiple metastable conformations. The microscopic behavior of individual metastable states and corresponding rates (k1, k-1, k2, k-2) have not been resolved. Transition probability matrices (red) and microscopic rate constant matrices (blue) are shown as colored grids. A rigorous mathematical derivation of this scheme is shown in Figure 7—figure supplement 3. (c) ITC enthalpogram for the titration of SAM into wild-type and K382P SETD8.

Figure 7.

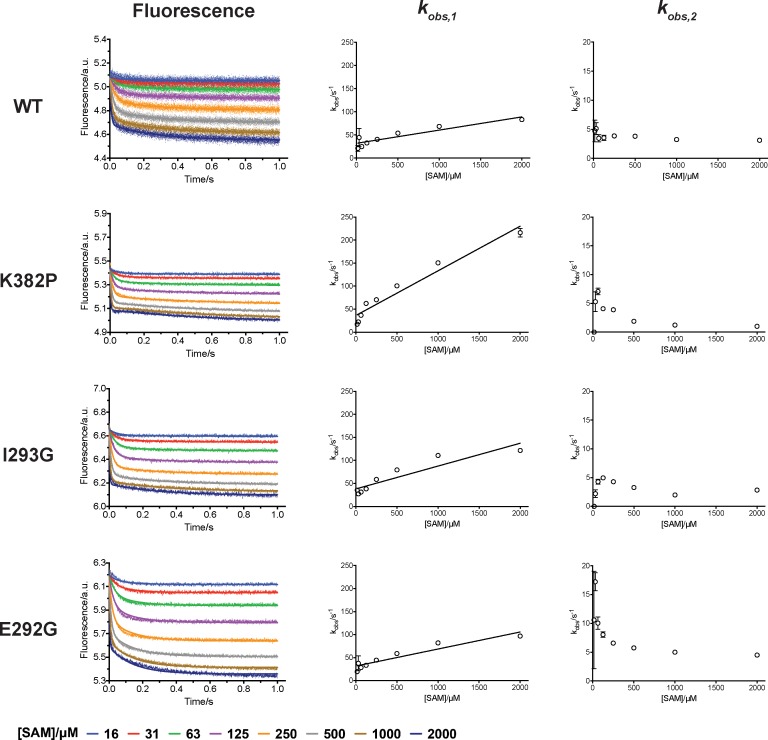
Figure 7—figure supplement 1. Rapid-mixing stopped-flow experiments of SAM-binding and double-exponential conventional fitting analysis.

Figure 7—figure supplement 1.

Fluorescence decrease of SETD8 wild-type and designed mutants in SAM binding were determined by rapid-mixing stopped-flow experiments and analyzed by two-step global fitting (left column). The data were also conventionally fitted into a double-exponential equation, and two kobs are plotted against SAM concentration.
Figure 7—figure supplement 2. Isothermal Titration Calorimetry (ITC) of wild-type SETD8 and its mutants in complex with SAM.

Figure 7—figure supplement 2.

Figures shown here are representatives of multiple replicates data.
Figure 7—figure supplement 3. Rigorous derivation of stepwise, microscopic resolution of SETD8 SAM-binding kinetics.

Figure 7—figure supplement 3.

A generalized kinetic mechanism for SAM binding that includes interconversion of apo- (E) and SAM-bound (ES) SETD8 among metastable conformational states is shown in Equation. S1. Equation. S2-S3 depict the corresponding kinetic model for time-evolution of apo- and SAM-bound populations in different conformational states, where the subscript i indexes conformational state. The time-dependent fluorescence signal can then be computed as a linear combination of the fluorescence of each species (Equation.S4). This kinetic model can be written in vectorial notation by writing the vector of populations of metastable conformational states as E (Equation. S10) and ES (Equation. S11), respectively (Equation. S5–S7), where rate constants are now denoted by matrices (Equation. S8–S9, S12–S13). Even more generally, populations for all chemical states can be gathered into a single vector X (Equation. S18) and the time-evolution and observed fluorescence for the entire system takes especially simple form (Equation. S14–S16). The observed fluorescence signal following rapid mixing can be decomposed into contributions from eigenfunctions |Un > and associated phenomenological rate constants kn (Equation. S17) arising from the dominant eigenvalues and associated eigenvectors of K (Equation. S19), and can be truncated to an equilibrium contribution (F) and the two dominant decay timescales if these processes dominate the eigenvalue spectrum of K.