
Fig. 1.
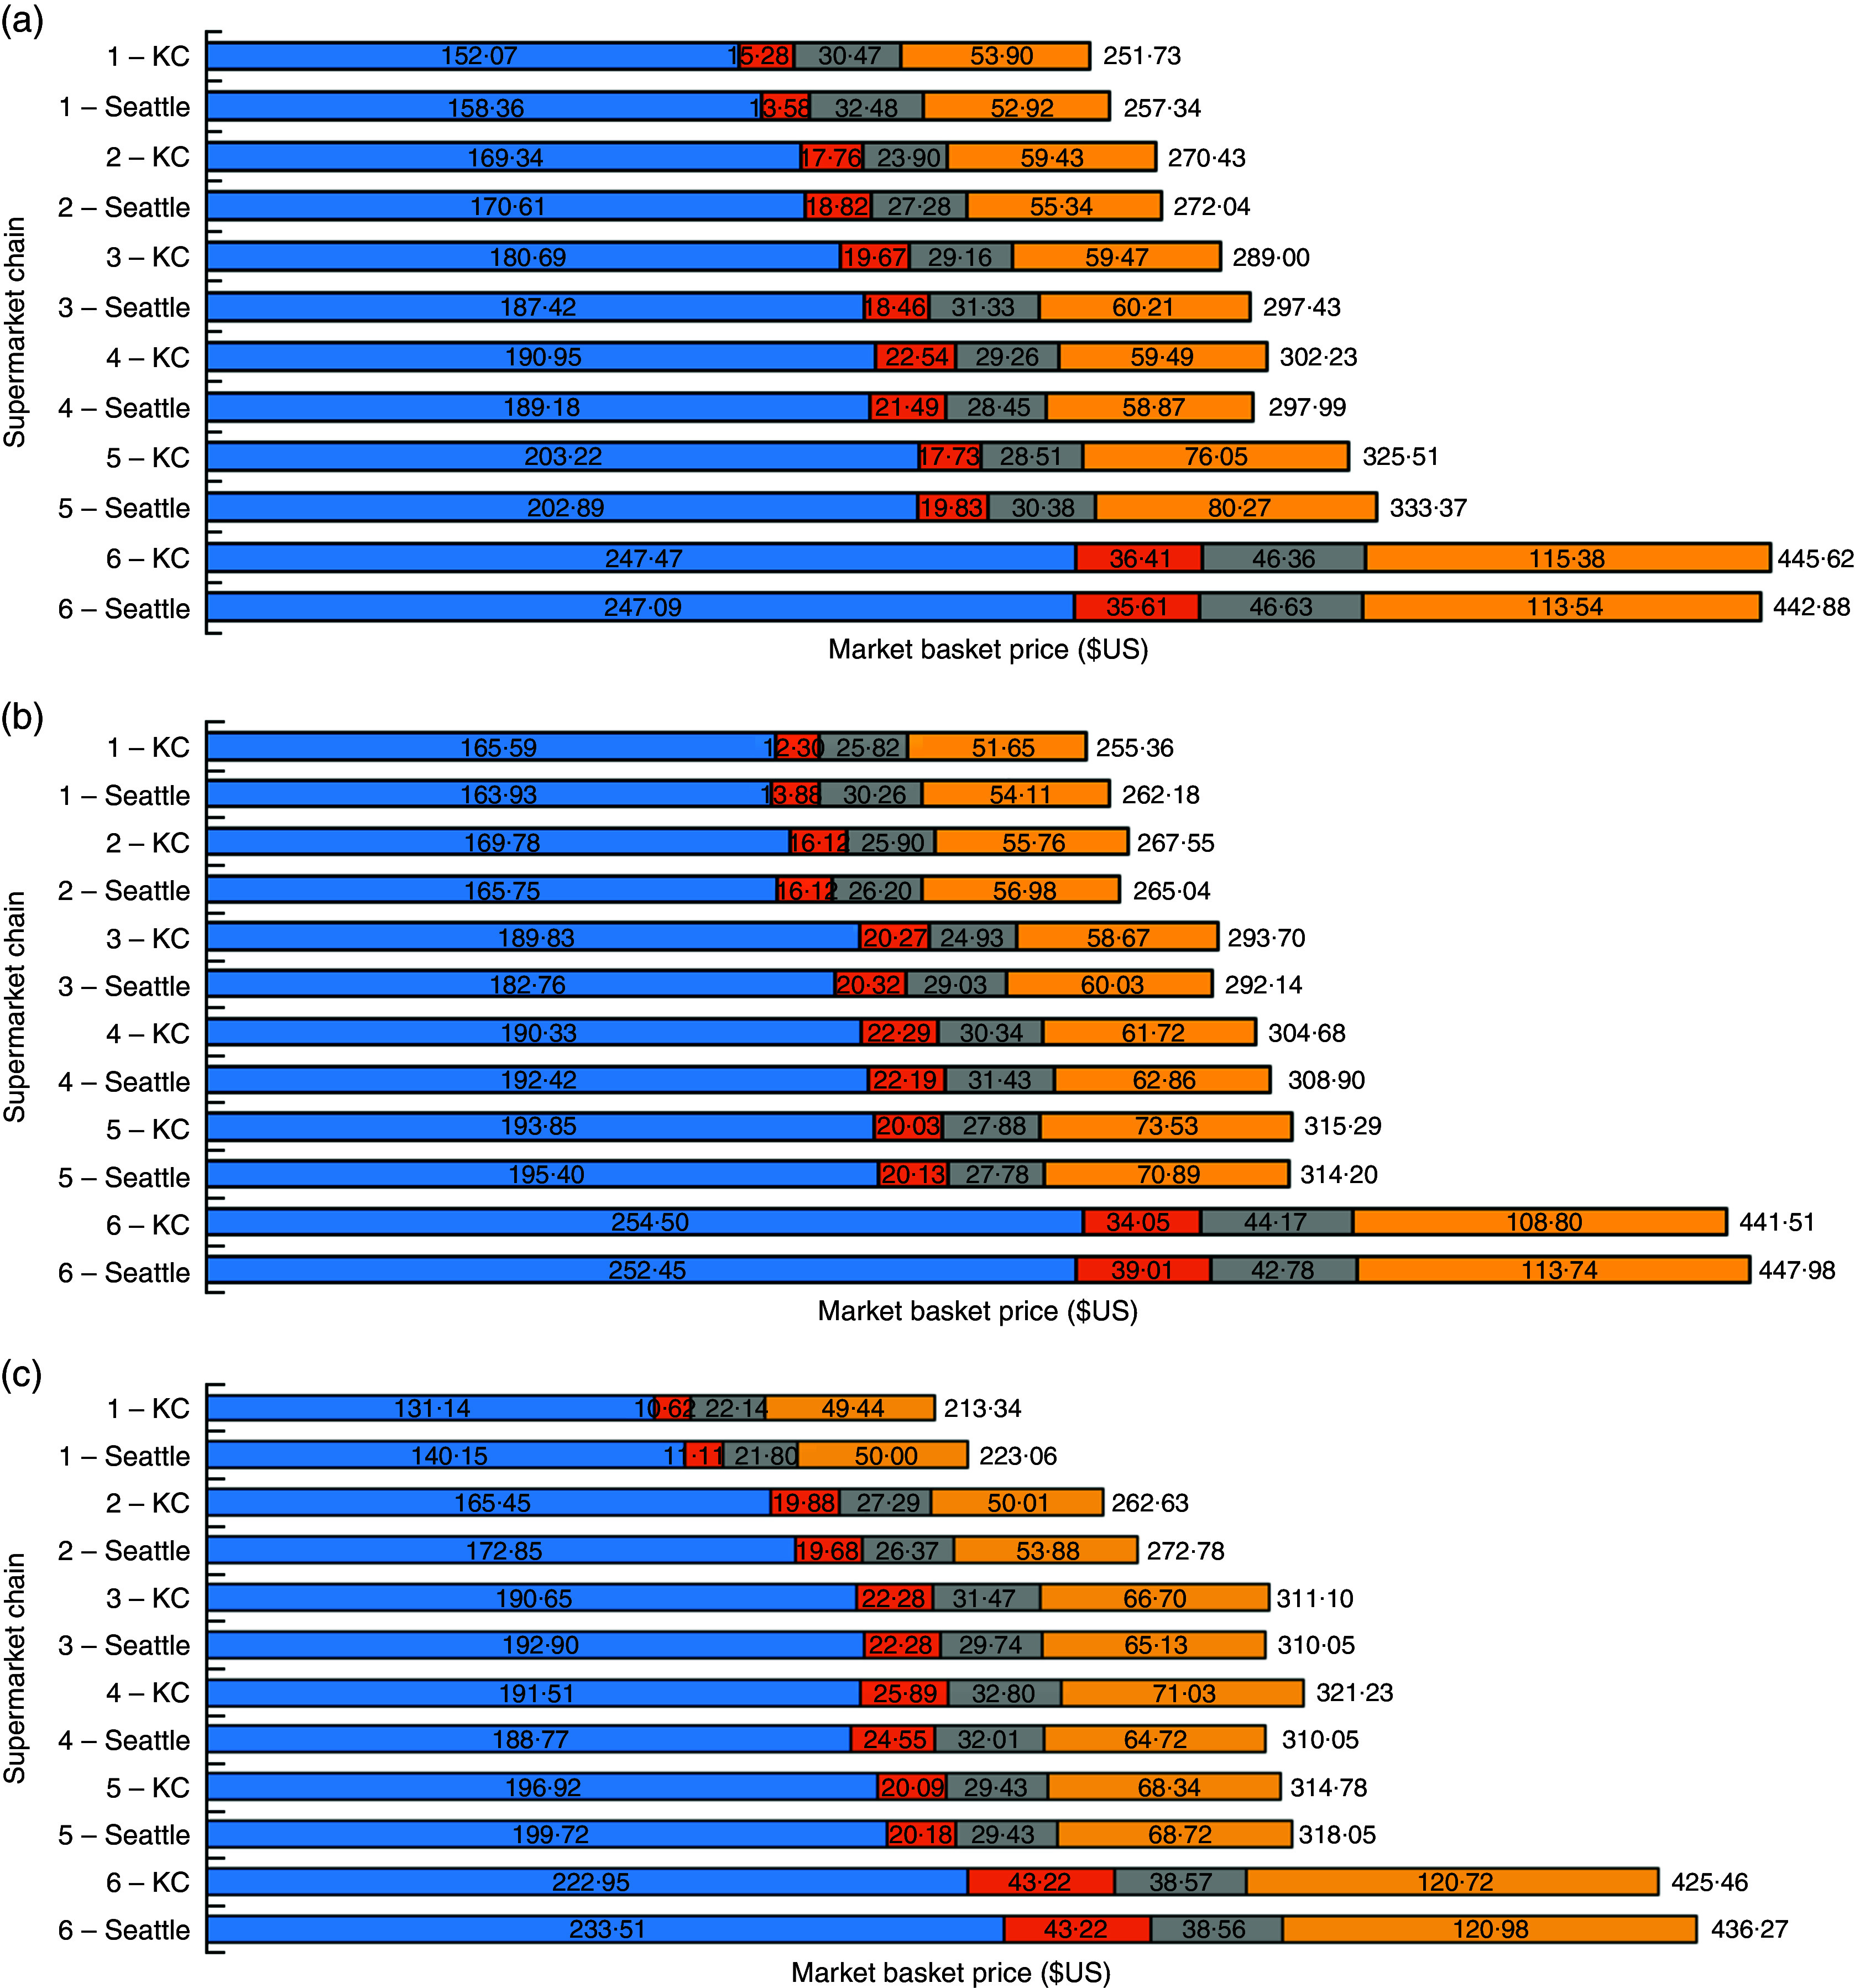
(colour online) Impact of Seattle’s minimum wage ordinance on supermarket food prices. Market basket item prices summed within food processing category ( , group 1: unprocessed or minimally processed foods;
  , group 2: processed culinary ingredients;
  , group 3: processed foods;
  , group 4: ultra-processed foods), by store chain (1–6) and location (Seattle, ‘intervention’; King County (KC), ‘control’) at (a) baseline (March 2015; 1-month pre-policy enactment), (b) follow-up 1 (May 2015; 1-month post-policy enactment) and (c) follow-up 2 (May 2016; 1-year post-policy enactment)