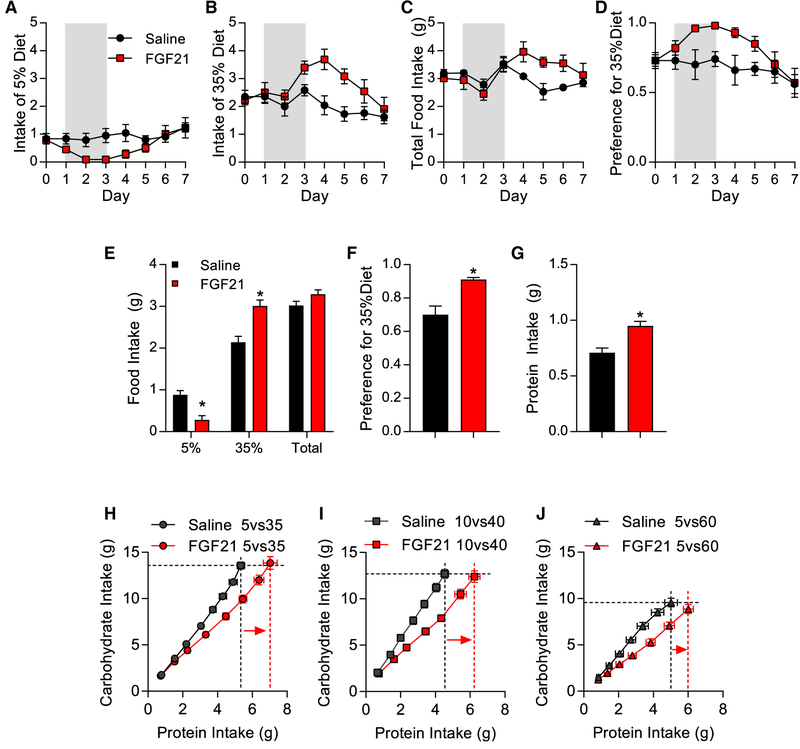
Figure 4. FGF21 Acts in the Brain to Increase Protein Intake.
(A–G) Wild-type mice selecting between isocaloric diets containing either 5% or 35% casein were given FGF21 injections into the lateral ventricle for three consecutive days. Shaded area denotes days of injection.
(A) Intake of 5% casein diet.
(B) Intake of 35% casein diet.
(C) Total food intake.
(D) Preference for 35% casein diet (35% casein intake divided by total).
(E) Average daily intake of various diets on days 1–5.
(F) Average preference on days 1–5.
(G) Average daily protein intake on days 1–5. 8 mice/group; *p < 0.05.
(H–J) Geometric analysis of FGF21-dependent shifts in cumulative protein and carbohydrate intake over days in mice choosing between multiple dietary combinations.
(H) Geometric analysis of mice choosing between 5% and 35% casein diets.
(I) Geometric analysis of mice choosing between 10% and 40% casein diets.
(J) Geometric analysis of mice choosing between 5% and 60% casein diets.
Horizontal, hashed lines reflect carbohydrate target of the saline group, whereas the vertical, hashed lines reflect protein target of the saline group in black and the FGF21 group in red. Arrows indicate FGF21-induced increase in protein intake. Data are represented as means ± SEM. 7–10 mice/group. *p < 0.05.

