Abstract
This study investigates radiofrequency (RF)-induced heating in a head model with a 256-channel electroencephalogram (EEG) cap during magnetic resonance imaging (MRI). Nine computational models were implemented each with different EEG lead electrical conductivity, ranging from 1 to 5.8 × 10⁷ S/m. The peak values of specific absorption rate (SAR) averaged over different volumes were calculated for each lead conductivity. Experimental measurements were also performed at 3-T MRI with a Gracilaria Lichenoides (GL) phantom with and without a low-conductive EEG lead cap (“InkNet”). The simulation results showed that SAR was a nonlinear function of the EEG lead conductivity. The experimental results were in line with the numerical simulations. Specifically, there was a ΔT of 1.7 °C in the GL phantom without leads compared to ΔT of 1.8 °C calculated with the simulations. Additionally, there was a ΔT of 1.5 °C in the GL phantom with the InkNet compared to a ΔT of 1.7 °C in the simulations with a cap of similar conductivity. The results showed that SAR is affected by specific location, number of electrodes, and the volume of tissue considered. As such, SAR averaged over the whole head, or even SAR averaged over volumes of 1 or 0.1 g, may conceal significant heating effects and local analysis of RF heating (in terms of peak SAR and temperature) is needed.
Keywords: Anatomical models, computational electromagnetic modeling, finite-element method (FEM), specific absorption rate (SAR)
I. Introduction
SIMULTANEOUS electroencephalography (EEG) and functional magnetic resonance imaging (fMRI) recordings provide data with combined high temporal and spatial resolution [2], [3] that are very helpful for the noninvasive study of brain function and disorders [4]. However, despite the great advantages of EEG-fMRI, cross-modal artifacts and MR safety caveats have limited its widespread use [3], [5]-[12]. A major concern when performing EEG-fMRI stems from possible excessive heating induced by the exposure of EEG electrodes/leads to the radiofrequency (RF) fields generated by MRI. RF currents are induced along the EEG leads [13], [14], which may in turn result in excessive RF energy absorbed in the area of contact between electrode and head. Computational modeling has been used to evaluate RF absorbed energy, calculated as specific absorption rate (SAR), in the head with EEG leads. It has been shown that the EEG leads effect on SAR is directly related to the conductivity of the EEG leads and varies with the EEG electrodes number, RF field strength, RF coil geometries, and electrical properties of the head tissues and EEG lead materials [3], [6]-[9], [11], [15]-[22].
The computational modeling studies to date, however, have suffered from several shortcomings. First, they have not provided a complete numerical quantification of the relationship between EEG lead conductivity and SAR induced in the head because SAR was computed across only five lead conductivities [7], suggesting an exponential increase of SAR versus conductivity. In particular, previous studies did not specifically analyze the range of 103‒5.9×10⁷ S/m, where the transition from low to high local induced currents occurs. It is hypothesized that in this range the relation between SAR and lead conductivity may be more complex than a simple exponential increase. Second, analyses were performed at 7 T rather than the more commonly used 3-T MRI scanner strength. Third, simulations were conducted using finite-difference time-domain (FDTD) models, which can lead to inaccurate results influenced by “staircasing” artifacts when modeling the small and curved structures of the EEG electrodes/leads with isotropic cubic meshes [6], [7], [23], [24]. Alternative methods, based on conformal tetrahedral meshes, such as the finite-element method (FEM), can produce more accurate results; however, no computational FEM models of the human head with EEG/MRI have been reported to date. Finally, a very limited number of studies have linked experimental measurement results to numerical simulations [6].
This study addresses the above issues by implementing FEM computational models to assess the relationship between EEG lead conductivity and induced SAR in an anatomically accurate head model with a 256-channel high-density EEG (hdEEG) sensor cap at 128 MHz (i.e., 3-T proton imaging). A wide range of lead conductivities was investigated, from 1 S/m (i.e., conductivity achievable with carbon-blended conductive inks) to 5.8 × 10⁷ S/m (i.e., the conductivity of copper, the material typically used in commercially available EEG caps). Experimental B1 maps and temperature measurements were performed to confirm the results of the numerical simulations.
This paper is organized as follows. Section II describes the computational model (geometrical and physical properties, numerical implementation for electromagnetic and thermal simulations, and uncertainty analysis) followed by the description of the experimental setup for B1 and temperature measurements. Section III includes the results of numerical electromagnetic and thermal simulations, numerical uncertainty analysis, and B1 and temperature measurements. This paper ends with the discussion and conclusion sections. Additionally, supporting documentation includes additional data and results with tables and figures, referenced in the main paper with the initial letter S.
II. Methods
A. Computational Model: Geometry and Physical Properties
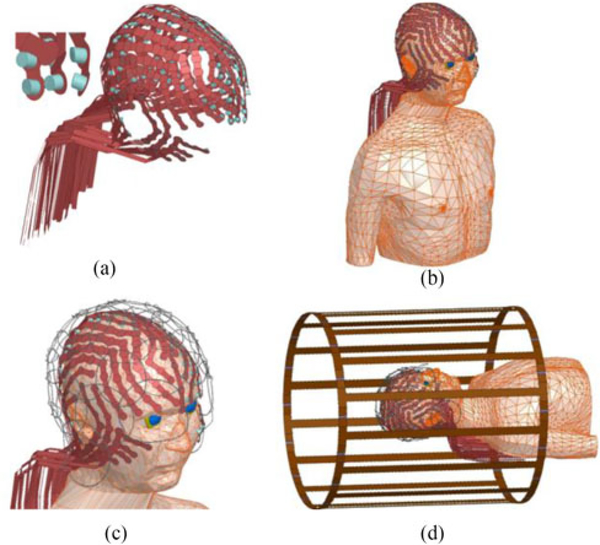
A realistic geometric model included an anatomically accurate head and torso model [13], [19], [25], a 256-channel hdEEG sensor cap, an RF transmit (Tx) coil [26], and a phased-array RF receive (Rx) coil model, see Fig. 1.1 The hdEEG cap included 258 electrodes (including the ground and reference electrode) multiplexed with 32 leads, each modeled as a 700 mm long × 8 mm wide strip to simulate multiple leads printed with conductive ink. The Tx coil was modeled based on a generic clinical RF Tx birdcage body coil [26], [27], and was loaded with the head-torso model with the hdEEG cap and (open-loop) Rx coil. Electrical properties of the anatomical structures were assigned based on available literature values for 128 MHz, see Table I. The RF transmit coil dimensions were assigned as in [26], and it was tuned as described in [26]. A tuning capacitance with an initial value was estimated and adjusted until the unloaded coil system was tuned at 128 MHz, for a final value of 13.5 pF. The coil input ports were on the superior end ring of the coil at 45° and 135° angles and defined as sinusoidal voltage input ports. Both ports were driven by identical voltage magnitudes but 90° phase difference to generate a quadrature excitation. A circuit solution comprised of a set of 32 voltage amplitude and phase offset inputs were computed and included in the high-frequency structural simulator (HFSS) model to scale the 3-D field solution to the tuned coil condition, using a 13.5-pF tuning capacitance. The input voltage of the coil input ports was then adjusted to 146 V in the circuit simulator [28].
Fig. 1.
(a) Computational model of 256-channel hdEEG cap. (b) Anatomical model (head and torso) with the hdEEG cap. (c) Anatomical model with the hdEEG cap and the RF receive array coil model. (d) Anatomical model with the hdEEG cap and the MRI RF receive and transmit coil models.
TABLE I.
Dielectric Properties Of Tissues At 128 Mhz [1]
| Anatomical Structure | Material | Permittivity | Conductivity(S/m) |
|---|---|---|---|
| Air sinus | |||
| Mastoid bones | Vacuum | 1 | 0 |
| Arteries | |||
| Blood in the Brain | Average (blood vessel and Blood) | 65 | 0.86 |
| Skull | |||
| Vertebral Column | Averaged Bone Cortical & Cancellous | 21 | 0.12 |
| Bone Facial | |||
| C4 cervical Bone | |||
| C3 cervical Bone | Cancellous bone | 26 | 0.18 |
| T1 Bone | |||
| Ribs | |||
| Grey Matter | Grey matter | 74 | 0.59 |
| White matter | White Matter | 53 | 0.34 |
| Nose | |||
| Ears | Cartilage | 53 | 0.49 |
| Larynx Cerebellum | Cerebellum | 80 | 0.83 |
| Cerebrospinal Fluid | Cerebrospinal Fluid | 84 | 2.2 |
| Ventricles Eye (Vitreous humor) | Vitrous humor | 69 | 1.5 |
| Fat Orbital fat | Fat (Not Infiltrated) | 5.9 | 0.037 |
| Head Average | |||
| Torso | Muscle | 64 | 0.72 |
| Trapezius | |||
| Retina | Retina | 65 | 0.92 |
| Skin | Skin (Wet) | 62 | 0.54 |
| Spinal Cord | |||
| Brain stem | Nerve | 44 | 0.35 |
| Nerve | |||
| Oesophagus | Oesophagus | 75 | 0.91 |
| Trachea | Trachea | 51 | 0.56 |
| Subcutaneous tissue | Average (muscle,cartilage and fat) | 41 | 0.41 |
B. Computational Model: Numerical Implementation
Numerical simulations at 128 MHz were implemented using HFSS (ANSYS, Burlington, MA, USA), a FEM-based solver. Simulation convergence was evaluated by ensuring that the maximum change in peak SAR in the head was less than 1% with concurrent solver passes of increasing mesh density. The total geometry, including the RF coils, EEG cap, and anatomical model simulated in HFSS, consisted of 403 433 tetra elements. The simulation ran on a DELL PowerEdge 730 PC with 763 GB of RAM and two 2.3-GHz Intel Xenon E5–2696 CPUs with 14 logical cores. RF coils were solved once and the electromagnetic field generated on the surface of a cylinder covering the entire model was saved. Such electromagnetic field was then used as a radiating boundary condition on the surface of this cylindrical container, which improved the simulation run time. The simulation run time for solving the MRI coils was around 12.5 h, while the simulations of the case with the cap (hdEEG) and without the cap (NoCap) lasted around 4 h each. The simulation runtime for the conductivity sweep was around 18 h.
The quantities of interest analyzed during postprocessing were the magnitude of the current density , electric field magnitude , and SAR at four resolutions; namely, the peak of the single-point SAR (pSAR), 0.1-g averaged SAR (0.1-g SAR), 1-g averaged SAR (1-g SAR), and SAR averaged over the whole head.2 These quantities were estimated for nine val-ues of EEG lead conductivity (σ) = 1, 10, 102,…, 106, 107, and 5.8 × 10⁷ S/m. The ratio of SAR with and without hdEEG was calculated as follows:
| (1) |
C. Temperature Simulations
The temperature simulations were performed by solving the heat equation
| (2) |
where T(K) is the absolute temperature, Cp(J/(kgK)) is the specific heat capacity at one atmosphere of constant pressure, ρ[kg/m3] is the mass density, KT [W/(mK)] is the thermal conductivity (Cρ = 3391 [j/kgK)], ρ = 1099 [kg/m3] and KT = 0.37 [W/(mK)] for skin [29]), and Φ is the volume of 1 g of head tissue at the point where T is estimated. The temperature distribution values of T were estimated by solving the heat equation in solids [see (2)], which is used to model heat transfer by conduction only. The equation was solved by considering the SAR calculated by the HFSS-based EM simulations (right term) as a heat source term. The external surface of the head was set to Dirichlet boundary conditions with T = 20.15 °C. The solution for temperature values T was calculated in a Cartesian 3-D and using a FEM-based commercially available software (Multiphysics 4.4, COMSOL, Burlington, MA, USA).
D. Uncertainty Analysis
Uncertainty analysis of the numerical simulations was performed as in [13] and [30]. The uncertainty for each parameter was calculated by selecting the original value plus a second value representing a linear increment in the original value associated with geometrical changes or intersubject variability; peak 1-g SAR in the head model was calculated for both values. Based on the two selected values and their 1-g SAR results, a sensitivity factor was calculated for each parameter and multiplied by the parameter standard deviation to estimate the uncertainty.
E. Experimental B1 Maps and Temperature Measurements
The numerical head model [25] was used to fabricate a custom-made mold for a Gracilaria Lichenoides (GL) phantom (Medical Modeling LLC, Golden, CO, USA). The mold [7] was composed of two equivalent parts (sagittal cut) that could be perfectly sealed together. A hole was present at the bottom of the mold to pour the following mix: 5.5-L distilled H2O, 550 g of GL Red Algae powder, and 49.5-g NaCl (purity: 98% Catalog No. 31, 016–6 Sigma Aldrich) [8]. This homogeneous GL phantom [8] was used to study temperature changes with the EEG leads and compare to the simulation results.
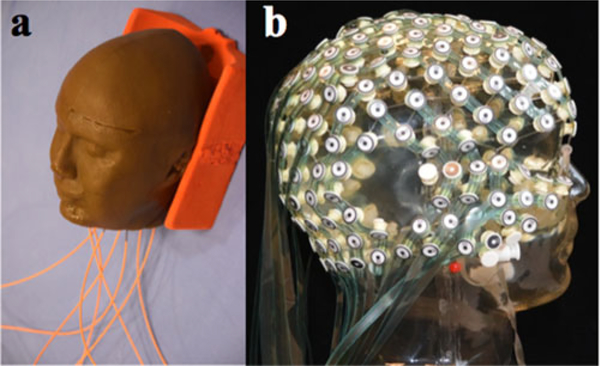
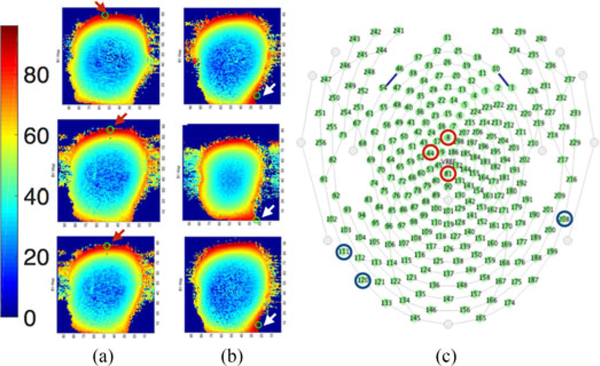
Two sets of measurement were performed, namely GL phantom alone and GL phantom with a high-density 256-channel hdEEG net (“InkNet [8]”). The leads were made of printed ink with a conductivity of 100 S/m. Eight optical temperature probes (OSENSA Innovations Corp., Coquitlam, BC, Canada) were used for the study, since a large number of probes may affect the GL phantom volume conductor (see Fig. 2). The eight temperature probes were placed in locations expected to report the highest local temperature rise [7], [21], [22]. Specifically, one probe was placed at the center of the GL phantom; four probes were placed at T7, T8, Cz, and Nasion (10–10 international electrode placement system); and the remaining three probes were placed at three largest ||B1|| peaks. In order to obtain the three largest ||B1|| peaks, an initial assessment was performed using maps of B1 magnitude (||B1||) to assess the distribution of RF power throughout the GL phantom. For this purpose, the GL phantom with and without InkNet was scanned at 3 T, then using a customized MATLAB (Mathworks, Natick, MA, USA) code, the 256-channel InkNet was coregistered to the GL phantom ||B1|| and the three ||B1|| peaks were mapped to the closest electrode in the InkNet sensor net map (see Fig. 3). The three ||B1|| peaks for the GL phantom alone were at electrodes #8, #44, and #81, which are near the Cz position, according to the 10–10 electrode placement system. Conversely, the three ||B1|| peaks for the GL phantom with the InkNet were at electrode numbers #111, #208, and #120, i.e., near the neck where the EEG leads were bundled.
Fig. 2.
(a) GL phantom used for measurements. Temperature probes are visible (orange plastic optical fibers). (b) hdEEG cap, InkNet.
Fig. 3.
||B1|| maps with a GL phantom without (a) and with (b) the InkNet. Arrows indicate location of the three largest peak values of ||B1|| as three locations in the GL phantom expected to undergo the highest temperature rise. Each ||B1|| peak was mapped to the closest electrode location of the InkNet registered to the GL phantom. (c) Schematic representation of the 256 electrode locations on the head. The bottom of the image corresponds to the back of the head. The three largest ||B1|| peaks for the GL phantom alone were around Cz and on top of the head (electrodes #8, #44, and #81 marked with red circle), whereas the three ||B1|| peaks for the GL phantom with the InkNet were around the neck (electrodes #111, #120, and #208 marked with blue circle) where the leads are bundled.
The following steps were followed to place the temperature probes in the designated locations: 1) the InkNet was placed on the GL phantom to determine electrode locations on the GL phantom surface; 2) a hole was drilled for each location at 5 mm depth; 3) the air gap was filled with thermally conductive paste, and 4) the temperature probe was placed (see Fig 2). Notably, for the thermal measurements without the cap, the InkNet was removed after placing the probes.
A high-power turbo spin echo (TSE) sequence (12 slices, 1mm3 voxels, TR/TE = 2150/226 ms, FA = 140°) was used for 30 min. The scanner-reported whole-head SAR was 3.2 W/kg.
III. Results
A. Specific Absorption Rate
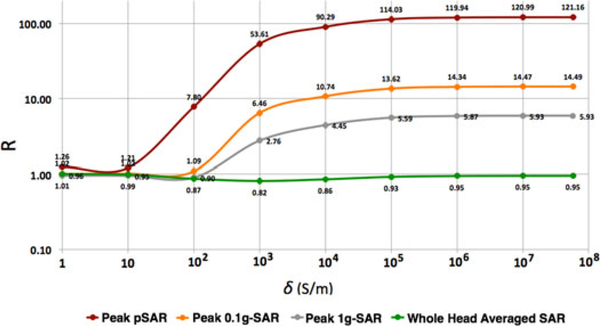
The value of R from (1) for whole-head averaged SAR was close to 1 for all values of conductivity (see Fig. 4). Conversely, R for pSAR3 varied nonlinearly with lead conductivity, with a minimum (R≈ 1) for σ less than 10 S/m. For values of 10 ≤ σ ≤ 105 S/m, there was a steep increase in R (1.21 < R < 114 pSAR value). Finally, R reached its plateau at 114.03 for σ > 105 S/m. The R values for peak 0.1-g SAR and 1-g SAR also varied nonlinearly with respect to lead conductivity. However, unlike the peak pSAR, the steep increase in R started at 100 S/m and, although they plateaued for σ > 105 S/m, they plateaued at much smaller R, namely 13.62 (0.1-g averaged SAR) and 5.59 (1-g averaged SAR), respectively, which are eight- and 20-fold smaller than the pSAR.
Fig. 4.
Values of R for nine hdEEG lead conductivities for peak single-point SAR (pSAR), peak 0.1-g SAR, peak 1-g SAR, and SAR averaged over the whole head.
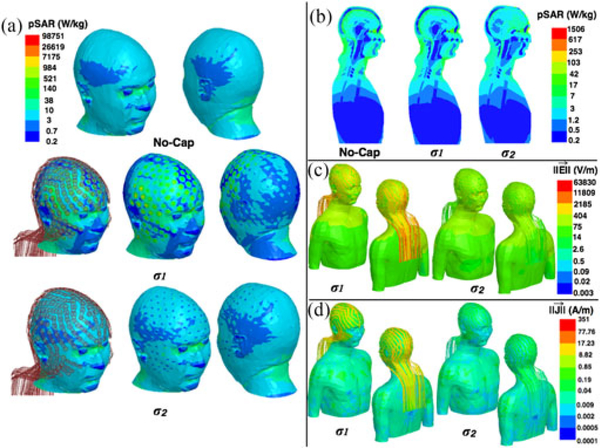
Additional analysis was performed for the cases of σ1=5.8107S/m (equivalent to copper) and σ2=40S/m (equivalent to low pSAR values), respectively. High values of pSAR at the skin-electrode interface were observed with hdEEG for σ1(pSAR = 9.87103 W/kg), compared to the pSAR for No-Cap (i.e., 1.72 × 10³ W/kg). This value was much smaller for σ2 (i.e., pSAR = 4.37 × 10³ W/kg), see Fig. 1.
B. Temperature Simulations
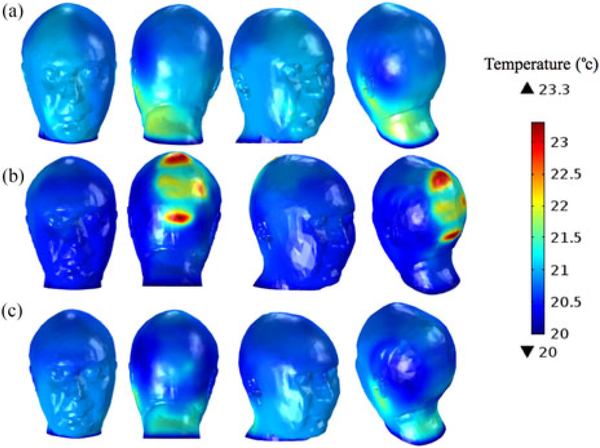
The simulations reported a maximum temperature rise in the head after 15 min of 1.8 °C for the GL phantom alone, 1.7 °C for the GL phantom with EEG cap leads of 40 S/m, and 3.3 °C for the lead conductivity equal to 5.8 · 107 S/m (see Fig. 6).
Fig. 6.
Temperature simulation results for the head model wearing (a) no EEG cap, (b) EEG cap with lead conductivities of 5.8 × 10⁷ S/m, and (c) EEG cap with lead conductivities of 40 S/m.
C. Experimental Temperature Measurements
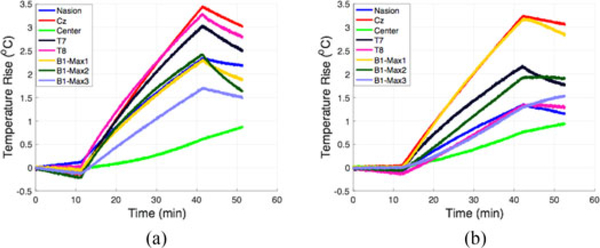
Experimental temperature measurements showed a maximum temperature rise of 1.7 °C in the GL phantom alone. The location with maximum temperature rise was around Cz. The location with the second highest temperature rise was around the ears (T7 and T8), with a temperature rise of 1.5 °C. Experimental temperature measurements in the GL phantom with the InkNet (σ = 100 S/m) showed a temperature rise of 1.5 °C, located in a position near the neck (see Table II), Fig. 7. Table III includes a full comparison of the temperature change measured versus simulated.
TABLE II.
Temperature Rise (In °C) In The Gl Phantom After 15 Min Of High-Power Mri Scanning
| Location | NoCap | InkNet |
|---|---|---|
| Nasion | 1.1 | 0.7 |
| Cz | 1.7 | 1.5 |
| Center | 0.3 | 0.4 |
| T7 | 1.5 | 1.1 |
| T8 | 1.6 | 0.7 |
| Bl-maxl | 1.1 | 1.5 |
| Bl-max2 | 1.2 | 1.0 |
| Bl-max3 | 0.9 | 0.6 |
Electrode number with B1 Max values:
NoCap—B1-max 1: electrode #8, B1-max 2: #44, B1-max 3: #81.
InkNet—B1-max 1: #111, B1-max 2: #208, B1-max 3:#120.
Fig. 7.
Temperature rise measured at 1 S/s rate in (a) GL phantom alone and (b) GL phantom with the InkNet. The first 10 min of recording is the baseline measurement with no MRI scanning. During the next 30 min, the high-power TSE sequences are applied then finished 10 min of no MRI scanning.
TABLE III.
Comparison Of Peak Temperature Rise After 15 Min In The Simulation And Experiments For The Nocap And Inknet Cases
| NoCap | InkNet | |||
|---|---|---|---|---|
| Simulation | Experiment | Simulation | Experiment | |
| (°C) | 1.8 | 1.7 | 1.7 | 1.5 |
| Difference (°C) |
0.1 | 0.2 | ||
D. Single Lead Versus Full hdEEG Cap
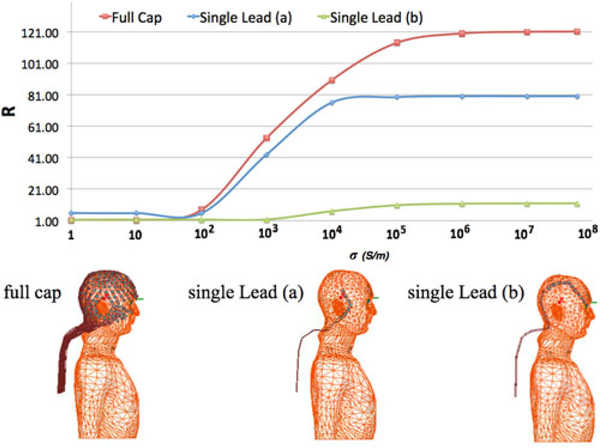
To study the effect of the number of EEG leads and peak pSAR deposited in the head, pSAR for the full EEG cap consisting of 32 leads was compared to two cases of single EEG leads. One EEG lead was the lead from the full cap that was closest to the peak pSAR location in the head with full cap and the other one was a neighboring lead. EEG lead conductivity was swept at the nine lead conductivities reported earlier. Comparison of the R ratio for every single lead and the full cap showed that the presence of the single lead induced a pSAR in the head 1.5-fold smaller than the full cap. The lead closer to the peak pSAR in the full cap resulted in R closer to the full cap than the neighboring lead (see Fig. 8).
Fig.8.
Top: R ratio computed for the peak pSAR in three different conditions: (bottom left) full cap; (bottom middle) single lead (a) corresponding to the lead that is the closest to the location of the peak pSAR; (bottom right) single lead (b) corresponds to a neighboring lead.
E. Uncertainty Analysis
The uncertainty analysis showed that the total uncertainty was 19.36%. The parameter with the highest single uncertainty was the skin permittivity (i.e., 10%) (see Table IV).
TABLE IV.
Simulation Uncertainty
| Parameter | Quantity | Val1 | Val2 | Res1 | Res2 | Sensitivity factor | Std deviation | Uncertainty |
|---|---|---|---|---|---|---|---|---|
| Trace conductivity [S/m] | 40.0 | 48.0 | 29.13 | 28.97 | 2.75E-02 | 0.04 | 0.11% | |
| Trace permittivity [-] | 4.20 | 5.04 | 29.13 | 29.13 | 0.00E+00 | 2.00 | 0.00% | |
| Sponge conductivity [S/m] | 2.14 | 2.57 | 29.13 | 29.1 | 5.15E-03 | 0.04 | 0.02% | |
| Sponge permittivity [-] | 84.7 | 102 | 29.13 | 29.13 | 0.00E+00 | 2.00 | 0.00% | |
| Skin conductivity [S/m] | 0.64 | 0.77 | 29.13 | 28.4 | 1.25E-01 | 0.04 | 1% | |
| Skin permittivity [-] | Peak lg-SAR [W/kg] | 49.8 | 59.8 | 29.13 | 29.43 | 5.15E-02 | 2.00 | 10.3% |
| Subcutaneous fat conductivity [S/m] | 0.43 | 0.52 | 29.13 | 29.09 | 6.87E-03 | 0.04 | 0.03% | |
| Subcutaneous fat permittivity [-] | 35.4 | 42.4 | 29.13 | 29.36 | 3.95E-02 | 2.00 | 7.9% | |
| Head position x [mm] | 0.00 | 10.0 | 29.13 | 29 | 4.46E-04 | 1.15 | 0.05% | |
| Head position y [mm] | 0.00 | 10.0 | 29.13 | 29.52 | 1.34E-03 | 1.15 | 0.15% | |
| Head position z [mm] | 0.00 | 10.0 | 29.13 | 28.37 | 2.61E-03 | 1.15 | 0.30% | |
| Total Uncertainty | 19.36% |
IV. Discussion
This study reports an analysis of RF-induced energy absorption and temperature increase in a head with hdEEG cap during MRI. computational FEM modeling and simulations, as well as B1 maps and temperature measurements at 3T MRI in a homogeneous GL phantom were used. An initial proof-of-concept was also performed in a simplified spherical model with a conductive lead. The results of the study showed that peak SAR (pSAR, 0.1-g SAR, and 1-g SAR) increases nonlinearly, rather than exponentially as previously reported [6], as a function of lead conductivity. The simulations with a 256-channel hdEEG cap model with copper leads showed a sixfold increase in peak 1-g SAR in the head model compared to the case without the cap. The change in the whole-head-averaged SAR with and without the cap was less than 20%, within the computational uncertainty.
Previous studies have also shown that the presence of conductive EEG leads can increase peak SAR (pSAR, 0.1-g SAR, and 1-g SAR) in the head [6], [7]. For example, Angelone et al. [6] reported a 62-fold increase in peak 1-g SAR in a head model with a 124-sensor hdEEG cap at 128 MHz/3 T, compared to the case without a cap. However, the results of the study were limited by the absence of a torso in the human body model, which precluded modeling a body coil and the full lead length, possibly also affecting RF-induced currents in the lead.
Thermal simulation results also confirmed that highly conductive EEG leads (5.8 × 10⁷ S/m) could cause a twofold temperature rise in the 1 g volume of skin tissue when compared to the EEG leads with lower conductivity values, i.e., 40 S/m and NoCap case. The 1.8 °C peak temperature rise reported in thermal simulations was close to the peak temperature rise of 1.7 °C measured in the GL phantom. Although the experimental and simulated thermal results were close in values, the locations of peak temperature rise were different. Specifically, the measured temperature peak was at Cz, while the simulated temperature peaks were on the left side, close to the ear. Additionally, temperature measurements performed for the GL phantom with the InkNet [8] showed a peak of 1.5 °C, which is close to the peak temperature rise of 1.7 °C reported for the simulation of the head with a hdEEG cap with 40 S/m leads. However, a direct comparison of the InkNet thermal measurements and the EEG cap with resistive leads is not feasible, because of wider EEG leads, a thicker substrate mesh, and omission of a dielectric insulation coating in the computational model as compared to the physical InkNet. Therefore, this study cannot be used as a direct numerical validation of the InkNet at 3 T.
It should also be noted that building an EEG cap to match the low-induced currents might not be feasible as the resistances of the leads may become equal to, or even greater than, the input impedance of the EEG amplifier. Thus, the transitional region is the most feasible region for choosing lead conductivity, and the designer must balance between limiting MRI induced currents by reducing and maximizing the signal-to-noise of the EEG recordings by selecting a larger value for σ.
Finally, although the FEM mesh used in this study can improve the staircasing artifacts when modeling the small and curved structures of the EEG electrodes/leads with isotropic cubic meshes [6], [7], [23], [24], the scope of this study did not include a direct comparison of the results using FEM and FDTD solvers, which remains to be addressed.
As expected, there was no heating due to the InkNet, which was similar to the results reported in the earlier studies at 7- and 3-T MRI [8], [22]. The peak temperature values measured experimentally were comparable to the simulations results, considering the accuracy of the temperature probes estimated to be around 0.5 °C (OSENSA, PRB-400). Notably, the numerical simulations were performed with an electrically heterogeneous model while the GL phantom was electrically homogeneous. However, previous studies performed with electrically homogeneous and heterogeneous models have been shown to provide similar electric field estimations [7]. Additionally, the local SAR with EEG leads is expected to be mostly on the surface of the GL phantom (i.e., affecting mostly one structure, namely the epider- mis/dermis), suggesting the validity of experimental validations with a geometrically matched homogeneous GL phantom [7]. Furthermore, the high conductivity of the GL phantom, due to the salinity of the red algae, enabled the detection of the B1 peaks near the electrodes on the surface. A standard water phantom at 3 T has the B1 field peaks in the center. Hence, the GL phantom mimics the B1 field distribution of a water phantom at higher main magnetic field strengths [31].
V. Conclusion
The simulations in this study show that the peak pSAR is a nonlinear function of the EEG lead conductivity, as computed in an anatomically accurate head model fit with a 256-sensor hdEEG cap, across nine different EEG lead conductivity values and normalized to the case of No-Cap (R).
The nonlinear relationship between pSAR and lead conductivity had three main regions: low-induced SAR (1 ≤ σ ≤ 10 S/m), transitional SAR (10 ≤ σ ≤ 105 S/m),and high-induced SAR (105 ≤ σ ≤ 5.8 107 S/m). Similarly, peak 1-g SAR and 0.1-g SAR had a similar nonlinear curve but with approximately 20- and eightfold smaller amplitude in the high SAR region and the transitional region starting at 100 S/m. The R for whole-head-averaged SAR was approximately constant (R = 1) for all nine lead conductivities. Results of this study indicate that location and volume of tissue considered can influence SAR assessment, and SAR averaged across the whole head, or even 1 or 0.1 g volumes, can conceal heating. Temperature simulations of this study showed that resistive EEG leads do not cause peak temperature rise more than the no EEG cap case, which was also confirmed by thermal measurements in a GL phantom.
Supplementary Material
Fig.5.
Results of numerical simulations for the head model with No-Cap, and with a hdEEG cap with σ1 = 5.8 107 S/m and σ2 = 40S/m. Images show: (a) Single-point SAR (pSAR)on the head surface. (b) pSAR in midsagittal plane. (c) Electric field magnitude. (d) Current density magnitude.
Acknowledgment
The authors would like to thank Dr. L. Wald for the constructive discussions.
This work was supported in part by the National Institutes of Health, i.e., in part by the National Institute of Neurological Disorders and Stroke under Grant R44NS071988 and in part by the National Institute of Biomedical Imaging and Bioengineering under Grant R01EB024343, and in part by the Research Participation Program at the Center for Devices and Radiological Health administered by the Oak Ridge Institute for Science and Education through an interagency agreement between the U.S. Department of Energy and the U.S. Food and Drug Administration. The mention of commercial products, their sources, or their use in connection with material reported herein is not to be construed as either an actual or implied endorsement of such products by the Department of Health and Human Services. (Corresponding author: Giorgio Bonmassar.)
Biography

Seyed Reza Atefi received the M.Sc. degree in biomedical engineering from the Chalmers University of Technology, Gothenburg, Sweden, in 2011, and the Ph.D. degree in applied medical engineering from the Royal Institute of Technology (KTH), Stockholm, Sweden, in 2015.
Since 2013, he has been a Research Fellow with Athinoula A. Martinos Center, Massachusetts General Hospital, Harvard Medical School, Charlestown, MA, USA. Since 2016, he has also been a consultant in Life Sciences and Bioelectromagnetics with ALTEN AB, Gothenburg.
Dr. Atefi received the Royal Academy of Engineering Sciences (IVA) Award in 2013.

Peter Serano received the M.Sc. degree in electrical and computer engineering from Worcester Polytechnic Institute, Worcester, MA, USA, in 2009.
He was an Electrical Engineer with InsightMRI from 2007 to 2009; with Bruker BioSpin in 2010; and with Athinoula A. Martinos Center for Biomedical Imaging, Massachusetts General Hospital, from 2011 to 2013, and also an ORISE Research Fellow with the U.S. FDA from 2014to 2017. He is currently an independent consultant specializing in medical device and MRI system modeling with ANSYS HFSS as well as the sole proprietor of Washington DC’s premier musical electronics repair shop in Washington, DC, USA.

Catherine Poulsen received the Ph.D. degree in experimental psychology from Concordia University, Montreal, QC, Canada, in 2000.
She was a Postdoctoral Fellow with Cognitive Neuroscience, University of Oregon, Eugene, OR, USA, from 2000 to 2002, and a Research Associate with Montreal Neurological Institute, Montreal, from 2003 to 2007. In 2007, she became a Scientist with Electrical Geodesics, Inc. (now Philips Neuro), Eugene, where she has been a Senior Scientist since 2016. She has been the Principal Investigator on several National Institutes of Health and Department of Defense grants involving basic and applied dense array EEG (hdEEG) research, as well as multimodal technology development projects for hdEEG and hemodynamic measurement of brain activity. Her work has been disseminated in more than 70 publications and conference presentations.

Leonardo M. Angelone (M’04) received the Laurea degree in electronic engineering from the University “La Sapienza,” Rome, Italy, in 2001 and the Ph.D. degree in biomedical engineering from Tufts University, Medford, MA, USA, in 2008.
He was a Research Fellow with Athinoula A. Martinos Center for Biomedical Imaging, Department of Radiology, Massachusetts General Hospital, Harvard Medical School. He has been a consultant with the Research and Development Department in the Surgical Products Division, Hologic, Inc., Marlborough, MA. He is currently a Research Biomedical Engineer with the Office of Science and Engineering Laboratories, Center of Devices and Radiological Health, U.S. FDA, Silver Spring, MD, USA. He leads a Research program that focuses on assessment of energy deposition and heating induced in the human body by medical devices using electromagnetic energy. The results of the projects have been presented in more than 100 peer-reviewed journal articles and conference proceedings, and publicly available software.

Giorgio Bonmassar (S’89-M’90-SM’10) was born in Milan, Italy, on May 13, 1962. He received the Laurea degree in electrical engineering from the University of Rome “La Sapienza,” Rome, Italy, in 1989, and the Ph.D. degree in biomedical engineering from Boston University, Boston, MA, USA, in 1997.
From 1989 to 1991, he was a Research and Development Systems Engineer with Ericsson, Rome; a Research Fellow from 1992 to 1997 and a Postdoctoral Fellow in 1997 with Boston University; a Research Fellow with Massachusetts General Hospital, Boston, from 1998 to 2000; and an Instructor with Massachusetts General Hospital, from 2000 to 2005. In 2005, he became an Assistant Professor and since 2017, he has been an Associate Professor in Radiology with Athi- noula A. Martinos Center, Massachusetts General Hospital, Harvard Medical School, Charlestown, MA. Since 2003, he has been the principal investigator for various National Institutes of Health and the Department of Defense grants. He has authored or coauthored more than 100 international journal papers and conference presentations on biomedical engineering.
Dr. Bonmassar is a member of the International Society for Magnetic Resonance Imaging and the Alfa Eta Mu Beta Biomedical Engineering Research Society. He received the North American Treaty Organization Advanced Research Studies Award in 1999 and a Whitaker Foundation Biomedical Engineering Grant for Young Investigators in 2000.
Footnotes
Coil dimensions and dielectric properties are in Tables SI and SII, which can be found in the supplementary material accompanying this paper.
A simplified model of a thin wire attached to a sphere placed inside a homogenous electromagnetic field and presented in Fig. S1, which can be found in the supplementary material accompanying this paper.
Fig S.3 and Table S.III, included in the supplementary material accompanying this paper, show that white matter and gray matter pSAR peaks are shifted by the presence of the copper leads and their shielding effect [18].
Contributor Information
Seyed Reza Atefi, Athinoula A. Martinos Center for Biomedical Imaging, Massachusetts General Hospital, Harvard Medical School, Charlestown, MA 02129 USA, and also with the University of Boras 50190, Boras Sweden (atefi@kth.se)..
Peter Serano, Division of Biomedical Physics, Center for Devices and Radiological Health, Office of Science and Engineering Laboratories, U.S. Food and Drug Administration, Silver Spring, MD 11401 USA (pete@serano.org)..
Catherine Poulsen, Philips Neuro, Eugene, OR 97401 USA (catherine. poulsen@philips.com)..
Leonardo M. Angelone, Division of Biomedical Physics, Center for Devices and Radiological Health, Office of Science and Engineering Laboratories, U.S. Food and Drug Administration, Silver Spring, MD 11401 USA (Leonardo.Angelone@fda.hhs.gov)..
Giorgio Bonmassar, Athinoula A. Martinos Center for Biomedical Imaging, Massachusetts General Hospital, Harvard Medical School, Charlestown, MA 02129 USA (giorgio.bonmassar@mgh.harvard.edu)..
References
- [1].Gabriel C, Compilation of the Dielectric Properties of Body Tissues at RF and Microwave Frequencies. London, U.K.: King’s College London, 1996. [Online]. Available: http://niremf.ifac.cnr.it/docs/DIELECTRIC/Report.html [Google Scholar]
- [2].Herrmann CS and Debener S, “Simultaneous recording of EEG and BOLD responses: A historical perspective,” Int. Psychophysiol, vol. 67, pp. 161–168, 2008. [DOI] [PubMed] [Google Scholar]
- [3].Mullinger K and Bowtell R, “Combining EEG and fMRI,” in Magnetic Resonance Neuroimaging: Methods and Protocols, Modo M and Bulte WMJ, Eds. Totowa, NJ, USA: Humana Press, 2011, pp. 303–326. [DOI] [PubMed] [Google Scholar]
- [4].Laufs H, “Functional imaging of seizures and epilepsy: evolution from zones to networks,” Curr. Opin. Neurol, vol. 25, pp. 194–200, 2012. [DOI] [PubMed] [Google Scholar]
- [5].Lemieux L, Allen PJ, Franconi F, Symms MR, and Fish DK, “Recording of EEG during fMRI experiments: patient safety,” Magn. Reson. Med, vol. 38, pp. 943–952, 1997. [DOI] [PubMed] [Google Scholar]
- [6].Angelone LM, Potthast A, Segonne F, Iwaki S, Belliveau JW, and Bonmassar G, “Metallic electrodes and leads in simultaneous EEG-MRI: Specific absorption rate (SAR) simulation studies,” Bioelectromagnetics, vol. 25, pp. 285–295, 2004. [DOI] [PubMed] [Google Scholar]
- [7].Angelone LM, Vasios CE, Wiggins G, Purdon PL, and Bonmassar G, “On the effect of resistive EEG electrodes and leads during 7 T MRI: Simulation and temperature measurement studies,” Magn. Reson. Imag, vol. 24, pp. 801–812, 2006. [DOI] [PubMed] [Google Scholar]
- [8].Poulsen C, Wakeman DG, Atefi SR, Luu P, Konyn A, and Bonmassar G, “Polymer thick film technology for improved simultaneous dEEG/MRI recording: Safety and MRI data quality,” Magn. Reson. Med, vol. 77, pp. 895–903, 2016. [DOI] [PMC free article] [PubMed] [Google Scholar]
- [9].Vanhatalo S, Alnajjar A, Nguyen VT, Colditz P, and Fransson P, “Safety of EEG-fMRI recordings in newborn infants at 3T: A study using a baby-size phantom,” Clin. Neurophysiol, vol. 125, pp. 941–946, 2014. [DOI] [PubMed] [Google Scholar]
- [10].Jorge J et al. , “Simultaneous EEG-fMRI at ultra-high field: Artifact prevention and safety assessment,” Neuroimage, vol. 105, pp. 132–144, 2015. [DOI] [PubMed] [Google Scholar]
- [11].Kuusela L, Turunen S, Valanne L, and Sipilȁ O, “Safety in simultaneous EEG-fMRI at3T: Temperature measurements,” Acta Radiologica, vol. 56, pp. 739–745, 2015. [DOI] [PubMed] [Google Scholar]
- [12].Jorge F and Pedro J, “Simultaneous EEG-fMRI at ultra-high field for the study of human brain function,” École Polytechnique Fédérale de Lausanne, Lausanne, Switzerland, 2016. [Google Scholar]
- [13].Serano P, Angelone LM, Katnani H, Eskandar E, and Bonmassar G, “A novel brain stimulation technology provides compatibility with MRI,” Sci. Rep, vol. 5, 2015, Art. no. 9805. [DOI] [PMC free article] [PubMed] [Google Scholar]
- [14].Guy A, Biophysics-energy absorption and distribution. AGARD Lecture Series, Radiation Hazards (Non-ionizing Radiations—Biological Effects and Safety Considerations 78, 1975. [Google Scholar]
- [15].Holmes MD, “Dense array EEG & epilepsy,” in Management of Epilepsy-Research, Results, and Treatment. London, U.K.: Intech, 2011, pp. 153–168. [Google Scholar]
- [16].Yamazaki M et al. , “Comparison of dense array EEG with simultaneous intracranial EEG for interictal spike detection and localization,” Epilepsy Res, vol. 98, pp. 166–173, 2012. [DOI] [PubMed] [Google Scholar]
- [17].Collins CM et al. , “Temperature and SAR calculations for a human head within volume and surface coils at 64 and 300 MHz,” J. Magn. Reson. Imag., vol. 19, pp. 650–656, 2004. [DOI] [PubMed] [Google Scholar]
- [18].Hamblin DL et al. , “EEG electrode caps can reduce SAR induced in the head by GSM900 mobile phones,” IEEE Trans. Biomed. Eng, vol. 54, no. 5, pp. 914–920, May 2007. [DOI] [PubMed] [Google Scholar]
- [19].Massire A et al. , “Thermal simulations in the human head for high field MRI using parallel transmission,” J. Magn. Reson. Imag., vol. 35, pp. 1312–1321, 2012. [DOI] [PubMed] [Google Scholar]
- [20].Nguyen UD, Brown JS, Chang IA, Krycia J, and Mirotznik MS, “Numerical evaluation of heating of the human head due to magnetic resonance imaging,” IEEE Trans. Biomed. Eng, vol. 51, no. 8, pp. 1301–1309, August 2004. [DOI] [PubMed] [Google Scholar]
- [21].Nöth U, Laufs H, Stoermer R, and Deichmann R, “Simultaneous electroencephalography-functional MRI at 3 T: An analysis of safety risks imposed by performing anatomical reference scans with the EEG equipment in place,” J. Magn. Reson. Imag., vol. 35, pp. 561–571, 2012. [DOI] [PubMed] [Google Scholar]
- [22].Vasios CE, Angelone LM, Purdon PL, Ahveninen J, Bel- liveau JW, and Bonmassar G, “EEG/(f) MRI measurements at 7 Tesla using a new EEG cap (“InkCap”),” Neuroimage, vol. 33, pp. 1082–1092, 2006. [DOI] [PubMed] [Google Scholar]
- [23].Holland R, “Pitfalls of staircase meshing,” IEEE Trans. Electromagn. Compat, vol. 35, no. 4, pp. 434–439, November 1993. [Google Scholar]
- [24].Railton CJ and Schneider JB, “An analytical and numerical analysis of several locally conformal FDTD schemes,” IEEE Trans. Microw. Theory Techn, vol. 47, no. 1, pp. 56–66, January 1999. [Google Scholar]
- [25].Makris N et al. , “MRI-based anatomical model of the human head for specific absorptionrate mapping,” Med. Biol. Eng. Comput, vol. 46, pp. 1239–1251, 2008. [DOI] [PMC free article] [PubMed] [Google Scholar]
- [26].Bonmassar G, Serano P, and Angelone LM, “Specific absorption rate in a standard phantom containing a deep brain stimulation lead at 3 Tesla MRI ,” in Proc. 6th Int. IEEE/EMBS Conf. Neural Eng., 2013, pp. 747–750. [Google Scholar]
- [27].Yeo DT, Wang Z, Loew W, Vogel MW, and Hancu I, “Local SAR in high pass birdcage and TEM body coils for multiple human body models in clinical landmark positions at 3T,” J. Magn. Resonance Imag, vol. 33, pp. 1209–1217, 2011. [DOI] [PMC free article] [PubMed] [Google Scholar]
- [28].Medical Electrical Equipment—Part 2–33: Particular Requirements for the Basic Safety and Essential Performance of Magnetic Resonance Equipment for Medical Diagnosis, TC 62/SC 62B, 2015 [Online]. Available: https://webstore.iec.ch/publication/2649
- [29].IT’IS Foundation, Zurich, Switzerland: [Online] Available: https://www.itis.ethz.ch/virtual-population/tissue-properties/database/dielectric-properties/ [Google Scholar]
- [30].Neufeld E, Kühn S, Szekely G, and Kuster N, “Measurement, simulation and uncertainty assessment of implant heating during MRI,” Phys. Med. Biol, vol. 54, pp. 4151–4169, 2009. [DOI] [PubMed] [Google Scholar]
- [31].Wiesinger F, de Moortele V, Adriany G, De Zanche N, Ugurbil K, and Pruessmann KP, “Parallel imaging performance as a function of field strength—An experimental investigation using electrodynamic scaling,” Magn. Reson. Med, vol. 52, pp. 953–964, 2004. [DOI] [PubMed] [Google Scholar]
Associated Data
This section collects any data citations, data availability statements, or supplementary materials included in this article.


