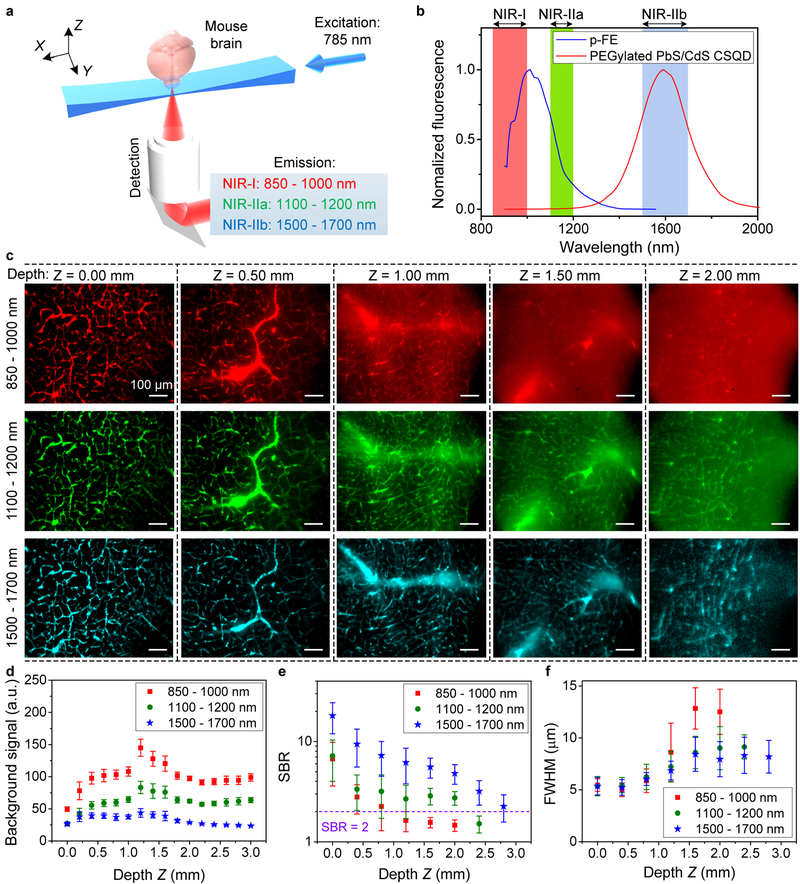
Figure 1 |. Light sheet microscopy in various NIR 850–1700 nm emission sub-regions in glycerol-cleared brain tissues.
(a) A simplified schematic of the NIR-II LSM. (b) Fluorescence emission spectra of p-FE and PEGylated PbS/CdS core/shell quantum dots (see Supplementary Fig. 2 for excitation spectra). Similar results for n = 5 independent experiments. (c) Light-sheet optical sectioning mouse brain vasculatures at various depths in NIR-I, NIR-IIa and NIR-IIb emission regions using the same 785 nm light sheet illumination kept constant power (0.33 mW) at different depths (also see Supplementary Video 1). Similar results for n = 3 (C57BL/6, female, 6 weeks old). The color bar range for each image is shown in Supplementary Fig. 3. Comparison of (d) background signal, (e) signal-to-background ratio (SBR) and (f) FWHM of smallest vessels at various depths. Background was measured from randomly selected area without vasculatures. SBR is the ratio of fluorescence signals in randomly selected vasculatures over the background. (d-f) The centre values are mean and error bars representing standard deviation were derived from analyzing ~ 10 target data at every depth. A 10X (NA = 0.25) imaging objective and a 5X illumination objective (effective NA = 0.039, light sheet waist w = ~15.2 μm and Rayleigh length b = ~ 1258.2 μm for 785-nm excitation, see Methods for light sheet shape analysis) were used in these experiments. Scale bars are 100 μm for all images in (c).

