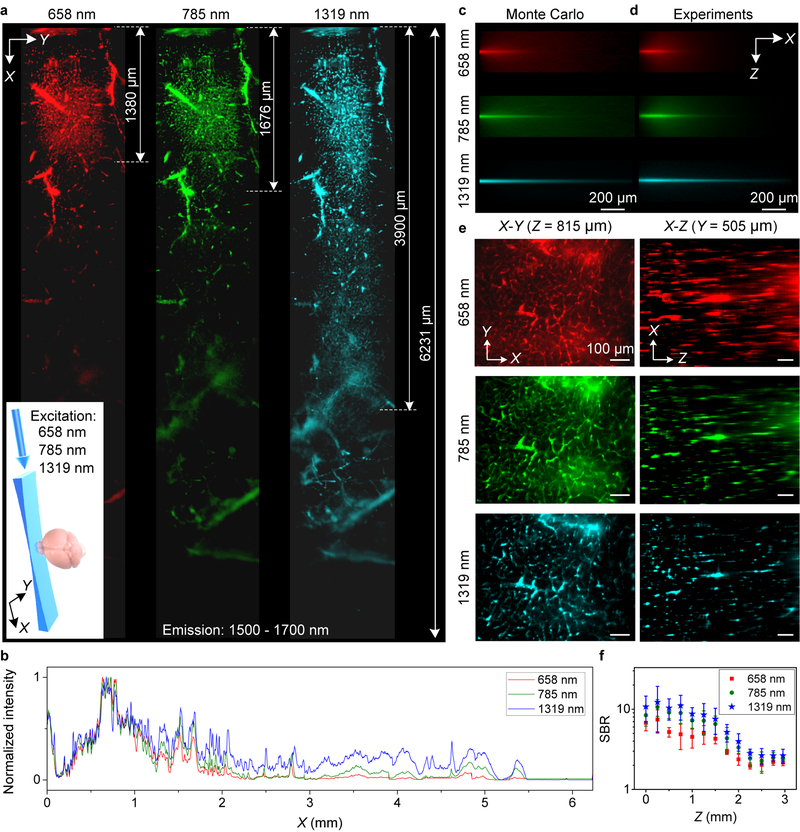
Figure 2 |. Propagation of light sheet excitation with progressively longer wavelength up to 1319 nm in glycerol-cleared brain tissues.
(a) X-Y images of 1500–1700 nm quantum dot fluorescence in the vasculatures of a fixed brain tissue at a depth Z = ~ 200 μm under 658 nm (0.22 mW), 785 nm (0.33 mW) and 1319 nm (1.4 mW) light sheet illumination as shown in the inset. 6 images were taken along X and stitched together for each light sheet. (b) Normalized sum intensity along Y direction of images in (a) as a function of propagation distance (X). Similar results for n = 2 (C57BL/6, female, 6 weeks old). (c) Monte Carlo simulations and (d) experimental results showing the X-Z propagations of different wavelengths light sheets in 2.5% intralipid tissue phantom (mimicking the brain) containing PEGylated PbS/CdS CSQD. Similar results for n = 3 independent experiments. Scattering coefficients were summarized in Supplementary Table 1. (e) Left: X-Y images of quantum dot 1500–1700 nm fluorescence in brain vasculatures taken at Z = 925 m under excitations by 658 nm, 785 nm and 1319 nm light sheets respectively (Supplementary Video 2). Right: images along the X-Z plane at a fixed Y, reconstructed from X-Y images at various depth Z (Supplementary Video 3). A 10X, 0.25-NA detection objective was used and LS excitation was generated by a 5X illumination objective with an effective NA of ~ 0.039. Similar results for n = 3 (C57BL/6, female, 6 weeks old). (f) Comparison of SBR for X-Y images recorded at different depth for 658 nm, 785 nm and 1319 nm excitation. About 10 randomly selected vasculatures and 10 areas without vasculatures were analyzed to calculate SBR at each depth. The centre values are mean and error bars represent standard deviation. Scale bars, 200 μm (c,d) and 100 μm (e).

