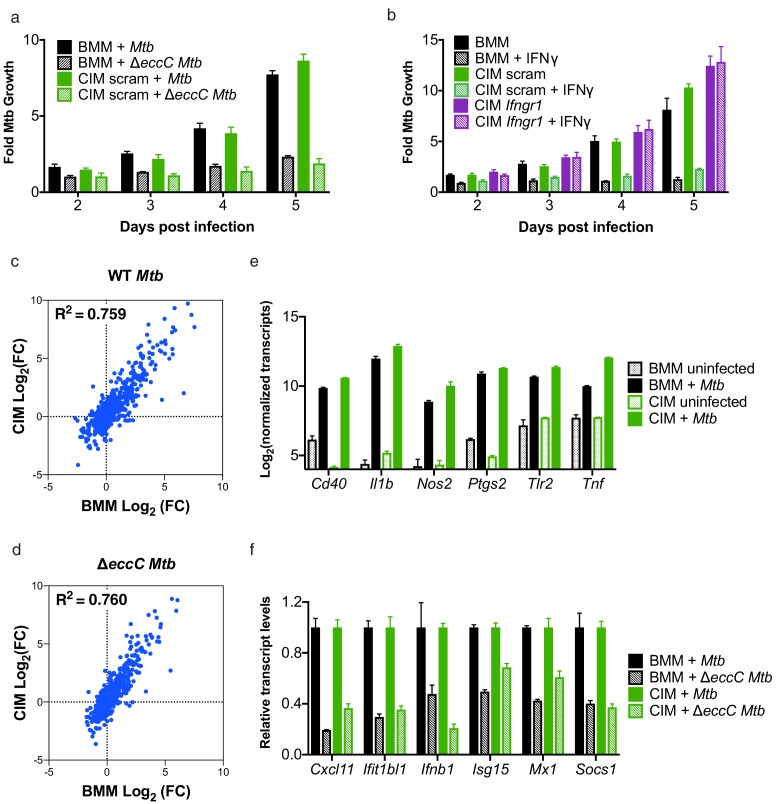
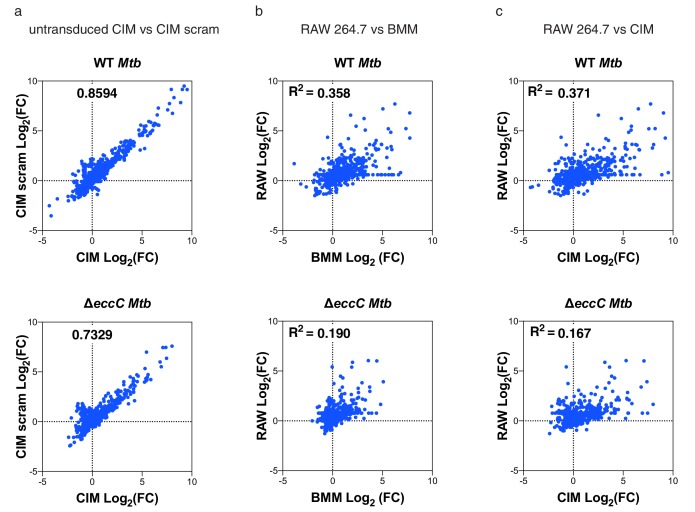
Figure 3. Cas9+ CIMs as an in vitro model for Mycobacterium tuberculosis infection.
(a) Luminescent bacterial growth assay. BMMs (black) vs. CIMs transduced with a scramble guide (green) were infected with M. tuberculosis-Erdman (solid bars) or a ΔeccC M. tuberculosis-Erdman strain (patterned bars) carrying the luxCDABE reporter operon at MOI = 0.5. Data are representative of two independent experiments each performed in triplicate, mean ± SD are shown. (b) Luminescent bacterial growth assay as in a, BMMs (black), CIMs transduced with a scramble guide (green), or CIMs transduced with a guide targeting Ifngr (purple) were infected with M. tuberculosis-Erdman Lux. Patterned bars indicate conditions where the different cell types were treated with IFNγ prior to and throughout infection. Fold-change in luminescence is reported as M. tuberculosis growth relative to t = 0 for each condition. Data are representative of four independent experiments each performed in triplicate, mean ± SD are shown. (c–f) mRNA levels in BMMs and CIMs, either uninfected or infected with WT (c) or ΔeccC M. tuberculosis (d) at MOI = 5 at 6 hr post infection were quantified using a Nanostring nCounter. Data are representative of two independent experiments. Source data is available as Figure 3—source data 1. c and (d) Data are presented as fold changes of infected/uninfected values of the average of technical duplicates from one experiment. (e) Log-transformed, normalized transcript counts for the indicated genes obtained from BMMs (black) vs. CIMs (green) before (patterned bars) or after infection with WT M. tuberculosis (solid bars). (f) Transcript counts for the indicated genes obtained from BMMs (black) vs. CIMs (green) infected with WT M. tuberculosis (solid bars) or M. tuberculosis ΔeccC (patterned bars). Transcripts were normalized to counts in WT M. tuberculosis infected macrophages.


