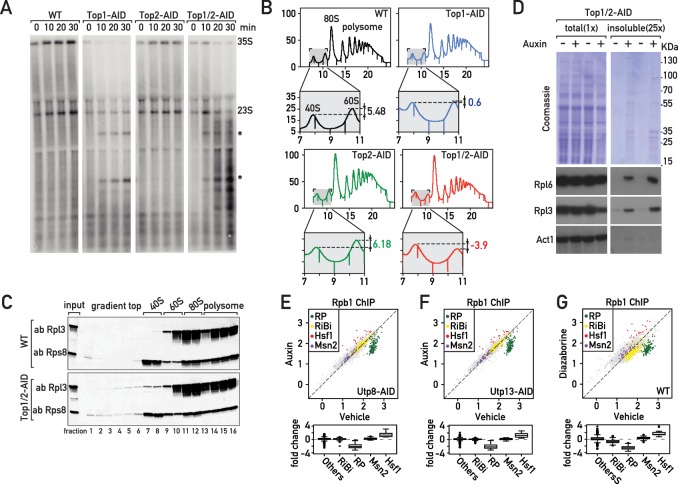
Figure 2. The effects of Top1 depletion on RNAPII regulation are linked to an underlying defect in ribosome biogenesis.
(A) Northern blot of 5’ETS1-containing rRNAs prepared from cultures of wild-type, Top1-AID, Top2-AID and Top1/2-AID cells that had been pulse-labeled for 2 min with [3H] adenine at the indicated times following addition of auxin to the media. Total RNAs were extracted and samples were separated on agarose gels, transferred to a nylon membrane and first directly autoradiographed to reveal pulse labeling of nascent rRNAs (see Figure 2—figure supplement 1C). The membrane was next hybridized with a 32P-labeled oligonucleotide probe allowing detection of all species containing 5’ETS1 (ACGACAAGCCT-ACTCGAATTCGT). Truncated pre-rRNA fragments, first identified in cells lacking Top1 (El Hage et al., 2010), are indicated (*). (B) Polysome sedimentation profiles (OD260) of WT, Top1-AID, Top2-AID, and Top1/2-AID strains 20 min following auxin treatment (large panels, as indicated). The top of each gradient (fractions 7 to 11), corresponding to 40S and 60S subunit peaks, is expanded below, where peak height differences (60S:40S ratio) are indicated. (C) Total cell extracts prepared from the indicated fractions of sedimentation profiles of WT and Top1/2-AID strains (from B) were TCA precipitated and analyzed by Western blot following SDS-PAGE, using an antibody against Rpl3 and Rps8, as indicated. (D) Total (left panels) and detergent-insoluble pellet (right panels) fractions isolated from lysates of Top1/2AID cells treated (+) or not (-) with auxin were analyzed by SDS-PAGE and Coomassie blue staining (top panels) or immunoblotting with the indicated antibodies (bottom panels). The pellet fraction is overloaded 25-fold compared to the total extract fractions. (E, F, G) Scatter plots (top panels) comparing RNAPII (Rpb1) ChIP-Seq read counts for individual genes in Utp8-AID (E) or Utp13-AID (F) cells after 20 min of auxin or vehicle treatment, or WT cells after 20 min of treatment with diazaborine or vehicle (G) (y-axis: auxin or diazaborine) for 20 min versus non-depleted cells (x-axis, Vehicle). Each dot represents a gene (5041 genes in total) and genes are color-coded according to functional groups, as in Figure 1A. Bottom panels display the corresponding box plots for the four indicated gene categories plus all other genes (others).


