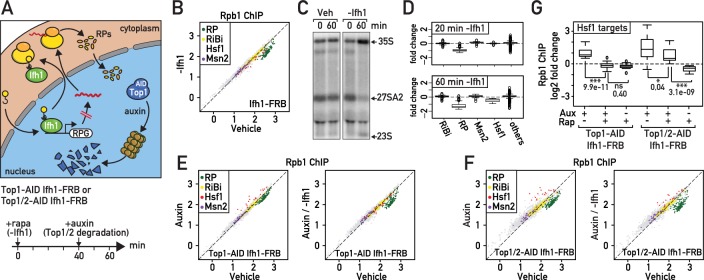
Figure 4. Downregulation of RP gene expression by Ifh1 nuclear depletion prior to RASTR initiation strongly dampens Hsf1 target gene activation.
(A) Schematic of protocol for Ifh1-FRB nuclear depletion (0–60 min of rapamycin treatment) followed by Top1-AID or Top1/2-AID degradation (auxin treatment, 40–60 min). (B) Scatter plot comparing RNAPII (Rpb1) ChIP-seq in Ifh1-FRB cells either rapamycin-treated for 60 min (y-axis, -Ifh1, Ifh1-FRB nuclear depletion) or untreated (x-axis, Vehicle, no Ifh1-FRB depletion). Categorization and color coding of genes as above. (C) Northern blots of pre-rRNA after 0 or 60 min of Ifh1-FRB nuclear depletion by anchor-away (-Ifh1) or vehicle (Veh) treatment of Ifh1-FRB strain. (D) Box plots of the data shown in (B) for the indicated five gene categories, showing fold-change upon Ifh1-FRB nuclear depletion compared to mock-treated cells. (E) Scatter plots comparing RNAPII (Rpb1) ChIP-seq in Top1-AID Ifh1-FRB cells either auxin-treated (y-axis, Aux, left panel) or auxin- plus rapamycin-treated (y-axis, Aux / -Ifh1, right panel) treated, as described in (A), versus untreated cells (x-axis, vehicle, both panels). (F) As in (E), but for Top1/2-AID Ifh1-FRB cells. (G) Box plots showing RNAPII (Rpb1) ChIP-seq change after rapamycin and/or auxin treatment for Hsf1 target genes in Top1-AID Ifh1-FRB cells (left) or Top1/2-AID Ifh1-FRB cells (right). Asterisks show significant difference according to student’s t-test (*: p<0.05, ***: p<0.001, ns: Not significant), p-value is indicated.
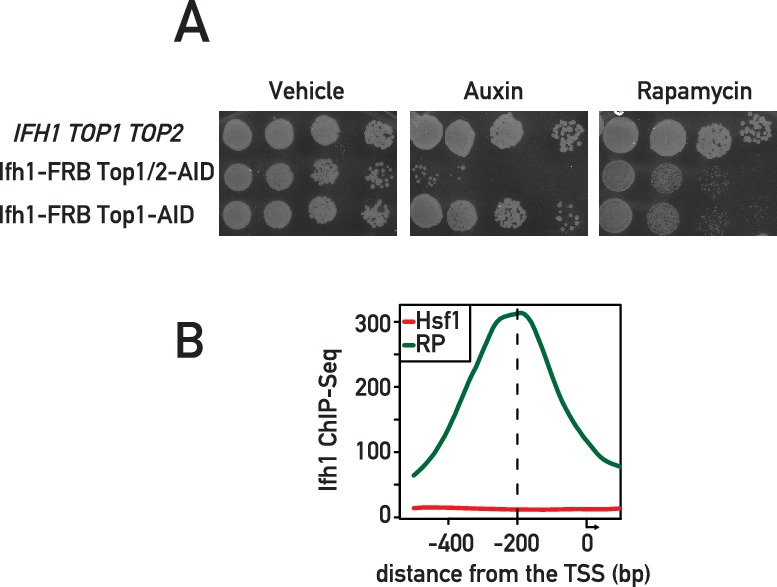
Figure 4—figure supplement 1. Characterization of Ifh1-FRB Top1-AID Top2-AID and Ifh1-FRB Top1-AID strains, and binding of Ifh1at Hsf1 target and RP gene promoters.


