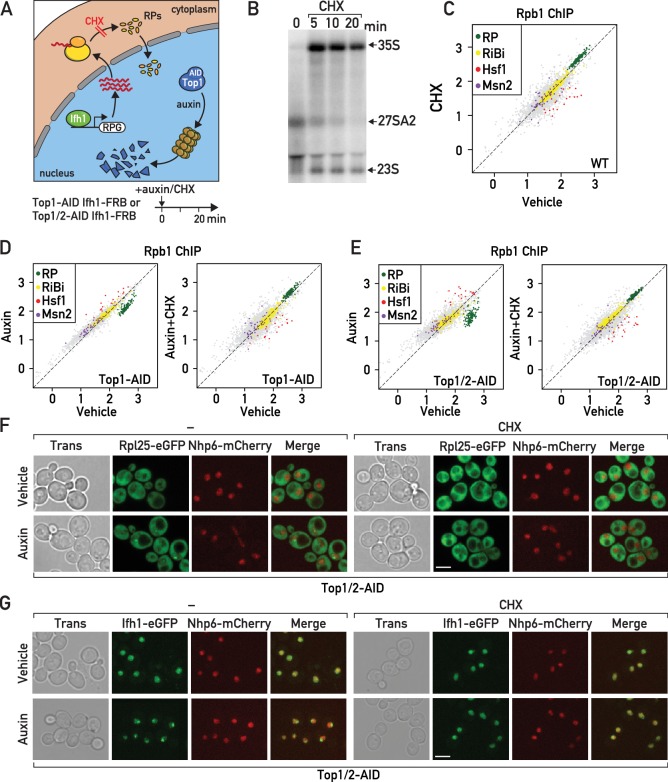
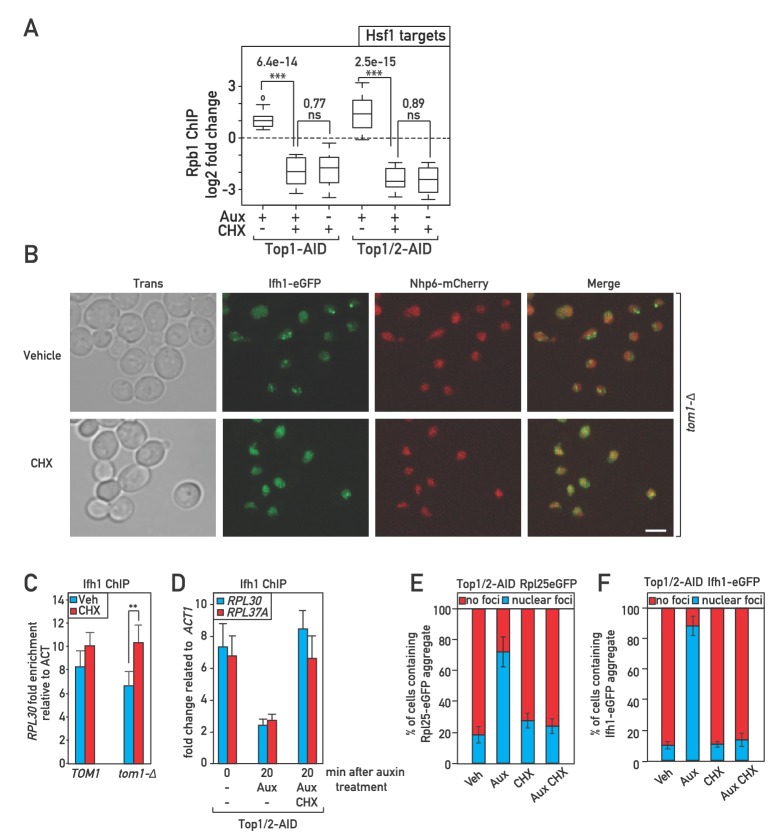
Figure 5. Cycloheximide treatment induces a rapid RNAPII transcriptional response opposite and epistatic to that of RASTR.
(A) Schematic related to experiments in subsequent panels describing the effect of cycloheximide treatment on de novo RP production and auxin treatment on Top1-AID (or Top1/2-AID) degradation. (B) Northern blots of pre-rRNA after 0, 5, 10, and 20 min of cycloheximide (CHX) treatment. (C) Scatter plot comparing RNAPII (Rpb1) ChIP-seq after 20 min of cycloheximide treatment (y-axis, CHX) to that of non-treated cells (x-axis, vehicle) at the indicated groups of target genes. (D) Scatter plots comparing RNAPII ChIP-seq in auxin-treated to untreated cells (left panel) and in auxin + cycloheximide (CHX)-treated to untreated cells (right panel). In both cases cells express Top1-AID. (E) Scatter plots comparing RNAPII ChIP-seq as in (D), but for Top1/2-AID cells. (F) Box plots showing RNAPII ChIP-seq fold-change for Hsf1 target genes after cycloheximide (CHX) and/or auxin (Aux) treatment of Top1-AID or Top1/2-AID cells, as indicated (data taken from experiments shown in D and E). p-Values are shown above the indicated comparisons together with significance according to student’s t-test (***: p<0.001, ns: not significant). (G–H) Top1/2-AID strains expressing Rpl25-eGFP (G) or Ifh1-eGFP (H) and Nhp6-mCherry were grown exponentially and samples were used for fluorescence microscopy analysis after 20 min of auxin (top) or vehicle treatment (bottom), in the absence (left) or presence (right) of cycloheximide (CHX).


