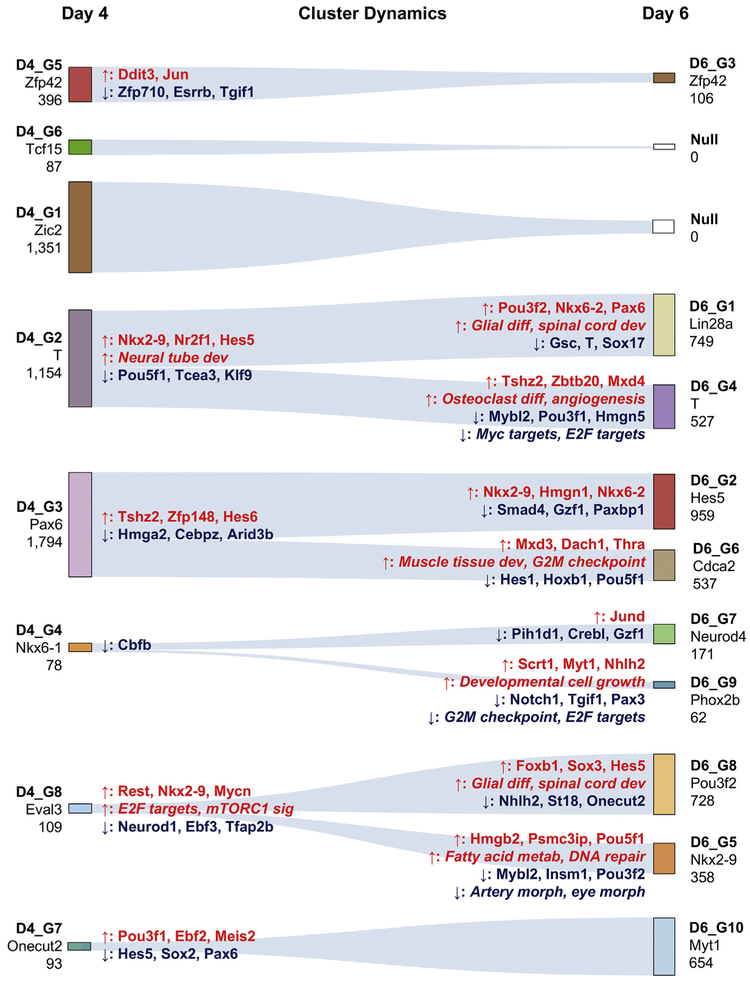
Fig. 7.
Cluster dynamics. Euclidean distances between D4 and D6 clusters were used to identify the most likely origin of each D6 cluster. A line was drawn from each D6 cluster to the closest D4 cluster. The number under the cluster name represents the number of cells in that cluster. The gene named under the cluster name is a gene that is representative of the population. Genes and pathways listed on the left (closest to day 4 clusters) are differentially expressed or enriched versus the derived D6 clusters. Arrows indicate direction of change. For example, Nkx2–9 is higher in D4_G2 versus both D6_G1 and D6_G4. Similarly, genes and pathways listed on the right (closest to day 6 clusters) are differentially expressed or enriched versus the originating D4 cluster. For example, Pou3f2 is up-regulated in D6_G1 (and not in D6_G4) versus D4_G2.

