
Fig. 2.
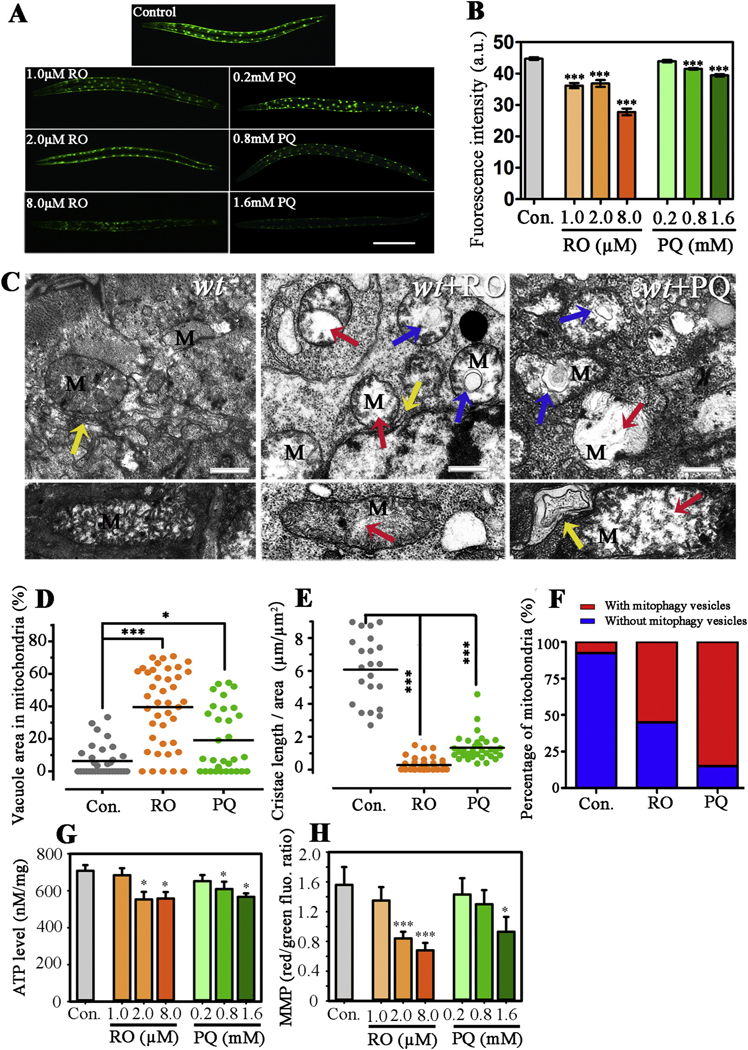
Effects of RO and PQ exposure on mitochondria in C. elegans. (A) Fluorescent images show changes of mitochondria in PD4251 nematodes after respectively exposed to RO and PQ for 3d. (B) Fluorescence intensity of GFP shows the changes of mitochondria. (C) Ultrastructure images show mitochondria (M) and endoplasmic reticulum in untreated and the RO/PQ exposed nematodes. Top and bottom rows show crosscutting and longitudinal images of representative mitochondria, respectively. Red arrows indicate vacuole areas. Blue arrows show the occurrence of autophagy vesicles in mitochondria. Yellow arrows indicate endoplasmic reticulum (ER). (D) The percentages of vacuole area in mitochondrial were analyzed in different groups. (E) Quantitative analysis of cristae membrane length with respect to total mitochondrial area. (F) The percentage of mitochondria with mitophagy vesicles in total mitochondria were analyzed in different groups. (G) The ATP level indicates ATP content in the total proteins. (H) The red/green fluorescence ratio of JC-1 shows the mitochondrial membrane potential (MMP) in different groups. Data are expressed as means ± SEM of four separate experiments (n ≥ 30). *p < .05, ***p < .001, when compared to the control. Bar = 200 μm in A. Bar =600 nm in C. (For interpretation of the references to colour in this figure legend, the reader is referred to the web version of this article.)