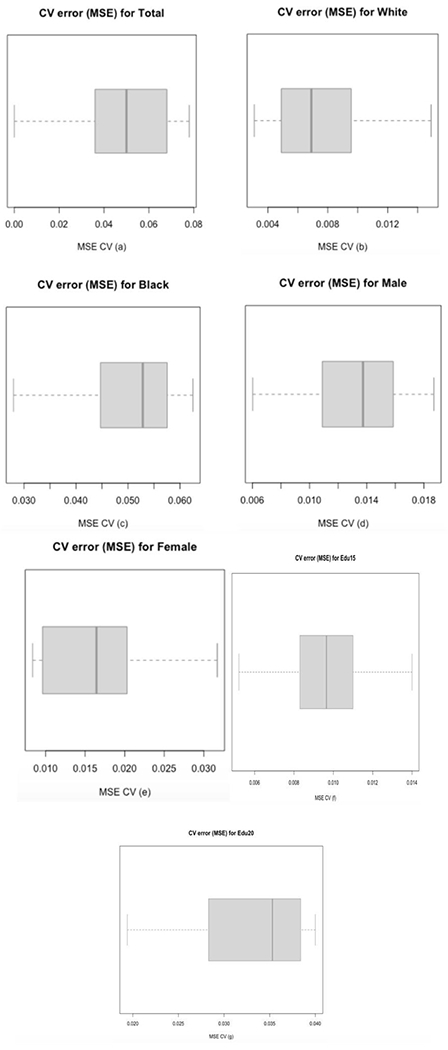
Figure 2. CV Error Box Plot:

a. CV error box plot for the Total Sample. From Table 1, three different ML models were selected; using 10-fold CV for the three models to select the best one. CV process is completed until accuracy is determined for each instance in the dataset, and an overall accuracy estimate is provided, which is the 10 CV errors. The values of 10 CV errors were used to construct the above box plot; the deep blue line (center line) marks the middle value of errors, with the upper and lower limits of the box being the third and first quartile (75th and 25th percentile) respectively, while the ends of the whiskers are the minimum and maximum errors. The average value of errors for the 10-fold CV on model 1 was 0.0484, the lowest in the three ML models; the other two ML models (2 and 3) yielded 0.0505 and 0.0625. Therefore, we can conclude model 1 is the best model among these three models.
b. This is the CV error box plot for the White sample. From Table 2, model 1 and 2 perform better than model 3; therefore a 10-fold CV was done for model 1 and 2. The basic function of 10-fold CV is explained in a. Based on the 10 CV errors, we drew the box plot, which has the same explanation as in a. The average value of errors for the 10-fold CV on model 1 is 0.0075 (the other model (2) is 0.0362). Model 1 is better than model 2.
c. This is the CV error box plot for the Black sample. From Table 2, model 1 and 3 perform better than model 2. Same as explained in a, from a 10-fold CV for model 1 and 3, we got 10 CV errors and draw box plot, which has the same meaning as in a. The average value of errors of model 1 is 0.0505 (model (3) gave a value of 0.0852). Model 1 does better than model 3.
d. This is the CV error box plot for the male sample. From Table 2, model 1 and 2 perform better than model 3. Using the explanation in a, the 10-fold CV on model 1 gave the above box plot and an average value of errors as 0.0130 (the other model (2) is 0.0283), which means model 1 performs better than model 3.
e. This is the CV error box plot for the female sample. From Table 2, three different ML models were obtained. Using the explanation in a, the 10-fold CV gave the above box plot and an average value of errors of 0.0169 for model 1, the lowest in the three ML models; the other two ML models (2 and 3) gave 0.0261 and 0.0280. We conclude that model 1 is the best model among these three models.
f. This is the CV error box plot for the Education11-15 sample. From Table 2, model 1 and 2 perform better than model 3; therefore a 10-fold CV was done for model 1 and 2. The basic function of 10-fold CV is explained in a. Based on the 10 CV errors, we drew the box plot, which has the same explanation as in a. The average value of errors for the 10-fold CV on model 1 is 0.0097 (the other model (2) is 0.0136). Model 1 is better than model 2.
g. This is the CV error box plot for the Education16-20 sample. From Table 2, model 1 and 2 perform better than model 3. Same as explained in a, from a 10-fold CV for model 1 and 2, we got 10 CV errors and draw box plot, which has the same meaning as in a. The average value of errors of model 1 is 0.0325 (model (2) gave a value of 0.0192). Model 1 does better than model 2.
