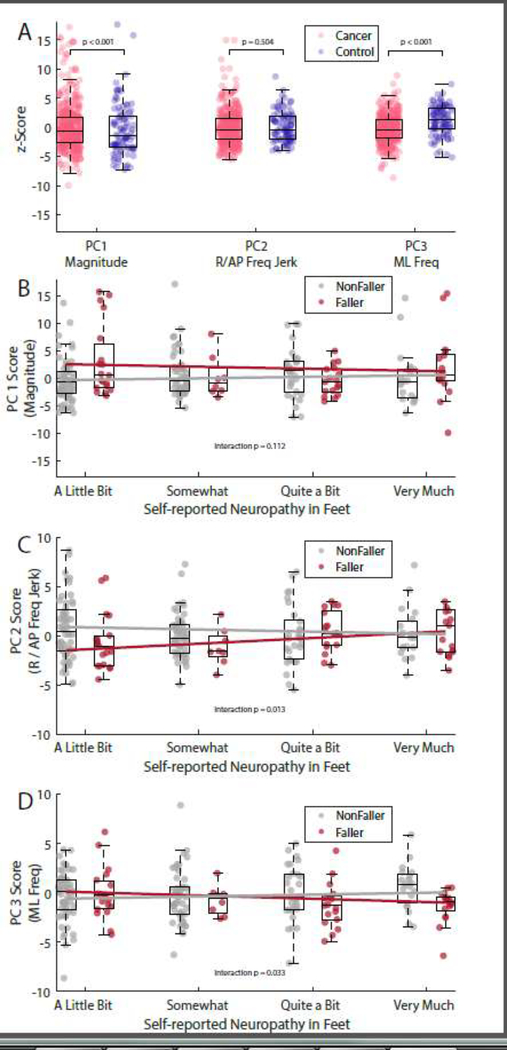
Figure 3.
Box and scatter plots showing the PC scores in cancer survivors and controls (A) and the interactions between neuropathy and postural sway, and falls in CIPN+ cancer survivors (BD). Scattered points indicate individual subjects contained within the boxplot representation of the group. Y-axes values indicate the z-score for each component, relative to the entire sample of cancer survivors and control subjects. For clarity, the scale on the y axes has been adjusted between panels A-D. A.) PC scores for the entire cancer cohort (pink) and healthy controls (blue). B-D.) Individual PC scores in cancer survivors with neuropathy, separated by self-reported faller status (fallers shown in red) and neuropathy severity (x-axis). Lines illustrate the interaction between self-reported neuropathy and postural sway in individuals with (faller, red) or without (nonfaller, gray) one or more reported falls in the previous six months.

