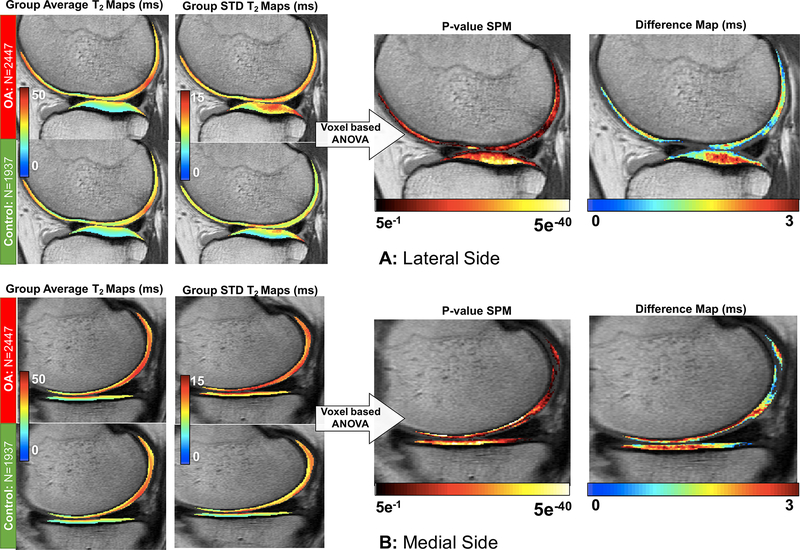
Figure 5.
Voxel-based statistical parametric map analysis of the baseline OAI dataset in distinguish subjects with and without sign of OA average and standard deviation maps are shown for OA and controls. T2 average prolongation observed in OA subjects and p-value map are also shown (N=1937). The maps show just voxel that reaches significance after adjustment for multiple comparison. (A) VBR analysis showed in a representative lateral slice. (B) VBR analysis showed in a representative medial slice.

