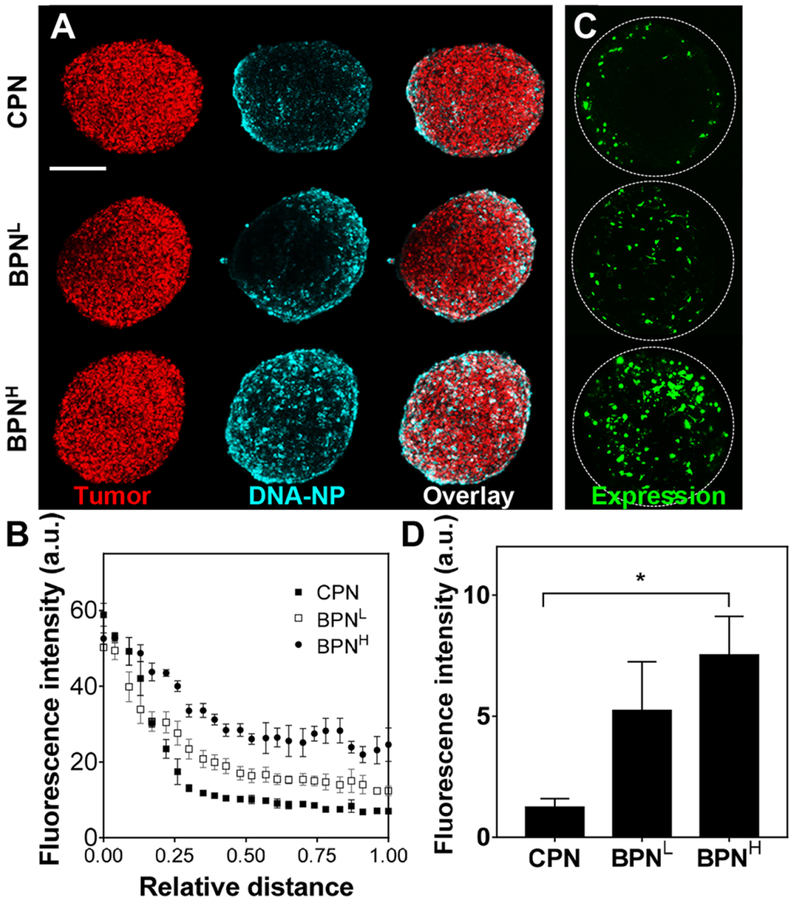
Figure 2. In vitro DNA-NP distribution and transgene expression in F98-based 3D spheroids.
(A) Representative images showing F98 tumor spheroids (red; mKate) 5 hours after treatment with DNA-NP (cyan; Cy5). Scale bar = 250 μm. (B) Quantification of radial distribution of DNA-NP within the spheroids. The coordinates 0 and 1 indicate the spheroid edge and core, respectively. (C) Representative reporter transgene expression (green; ZsGreen) by DNA-NP carrying ZsGreenexpressing plasmids 48 hours after NP-treatment. (D) Quantification of ZsGreen transgene expression within the spheroids. Differences are statistically significant as indicated (*p < 0.05).

