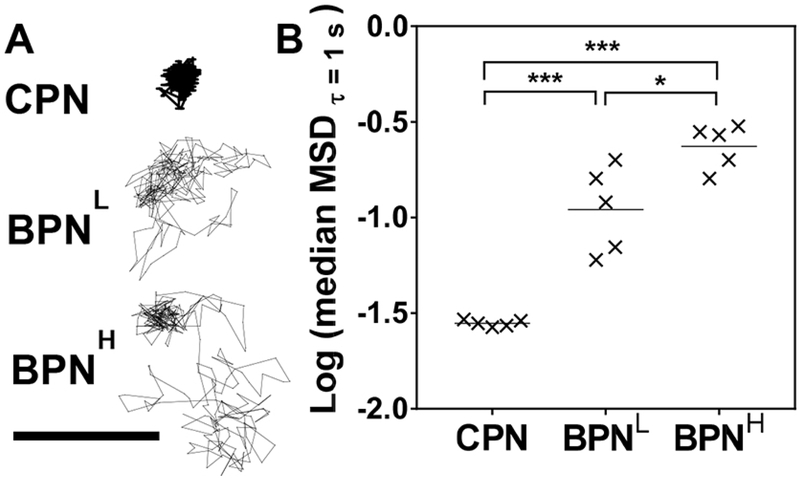
Figure 3. Ex vivo diffusion of different DNA-NP in rat brain tissues.
(A) Representative trajectories of DNA-NP in rat brain tissue over 20 seconds. Scale bar = 1 μm. (B) Logarithms of median mean square displacements (MSD) of DNA-NP at a time scale of 1 second. Data represent 5 independent experiments with n ≥ 200 particles tracked for each experiment. Differences are statistically significant as indicated (*p < 0.05; ***p < 0.001).

