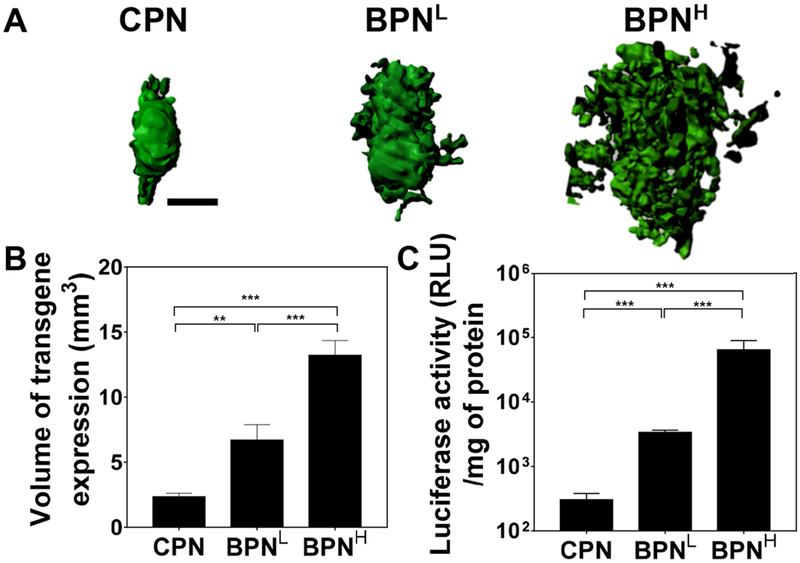
Figure 4. In vivo transgene expression mediated by CED of different DNA-NP carrying ZsGreen- or luciferase-expressing plasmids in healthy rat brain tissues.
(A) Representative isosurface 3D images depicting volumetric distribution of ZsGreen reporter transgene expression (green) in healthy rat brains, obtained by stacking multiple sequential confocal images 48 hours after NP-treatment carrying ZsGreen-expressing plasmids. Scale bar = 1 mm. (B) Volume of ZsGreen transgene expression (n ≥ 6 rats). (C) Overall level of luciferase transgene expression (n ≥ 6 rats). Differences are statistically significant as indicated (**p < 0.01;***p < 0.001).

