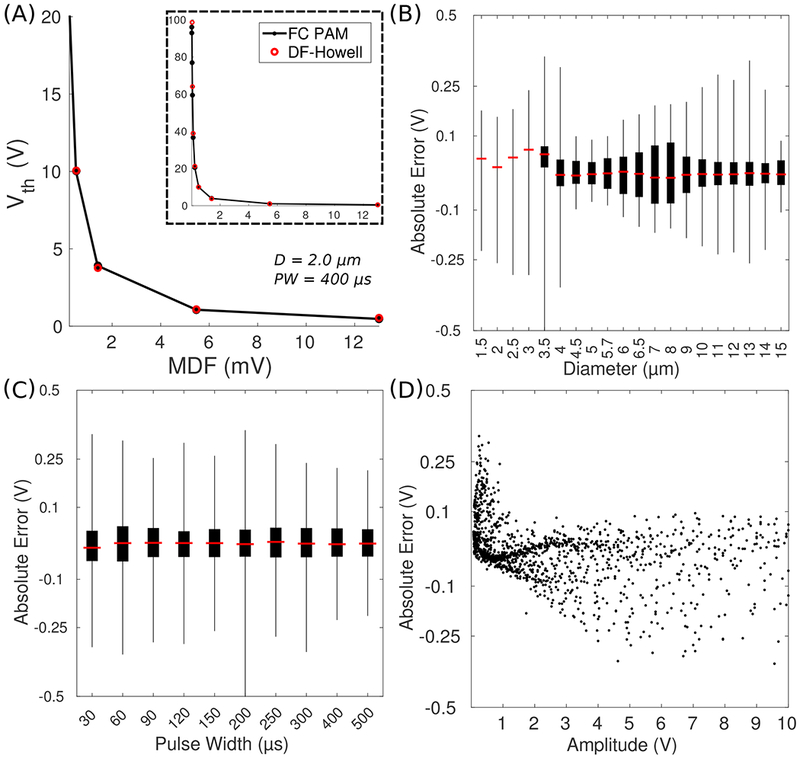
Figure 4.

DF-Howell training. (A) Activation thresholds (Vth) as a function of the modified driving force (MDF) for a given combination of fiber diameter (D) and pulse width (PW). Inset: y-axis extended to 100 V. FC = field-cable, PAM = pathway-activation model, DF = driving force. (B) Error of Vth versus fiber diameter. Box plot whiskers represent minimum and maximum of all data. (C) Error of Vth versus pulse width. (D) Error of Vth versus the amplitude of the applied voltage.
