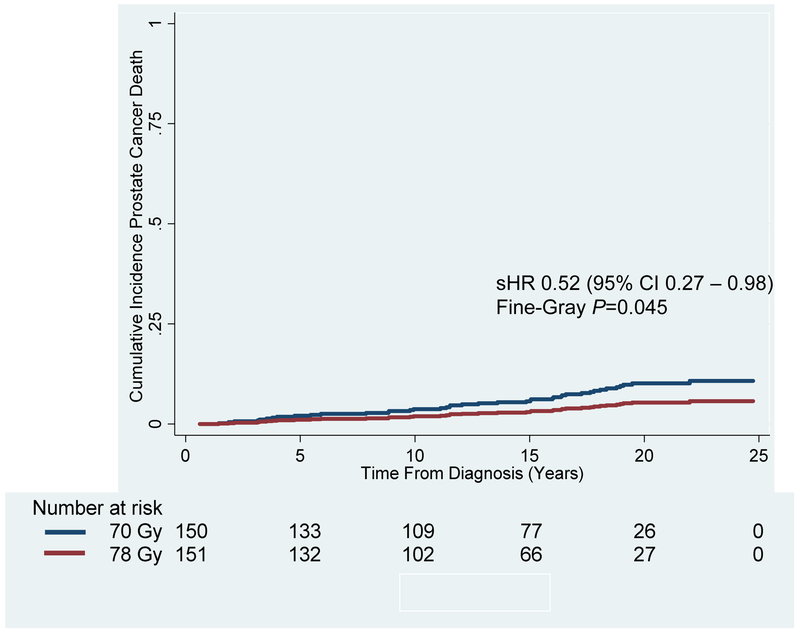
Figure 4: Cumulative Incidence of Prostate Cancer-Specific Mortality for the Entire Patient Cohort Treated to 70 Gy vs. 78 Gy.
Cumulative incidence of prostate cancer-specific mortality at 15 and 20 years was significantly higher in the patients receiving 70 Gy (Blue Line; 6.2% and 10.2%, respectively) compared to 78 Gy (Red Line; 3.2% and 5.4%, respectively) (Subhazard Ratio [sHR] 0.52, 95% Confidence Interval [CI] 0.27 – 0.98; Fine-Gray P=0.045).

