
Figure 2. SHIELD preserves FP signals, proteins, transcripts, and their probe-binding affinities.
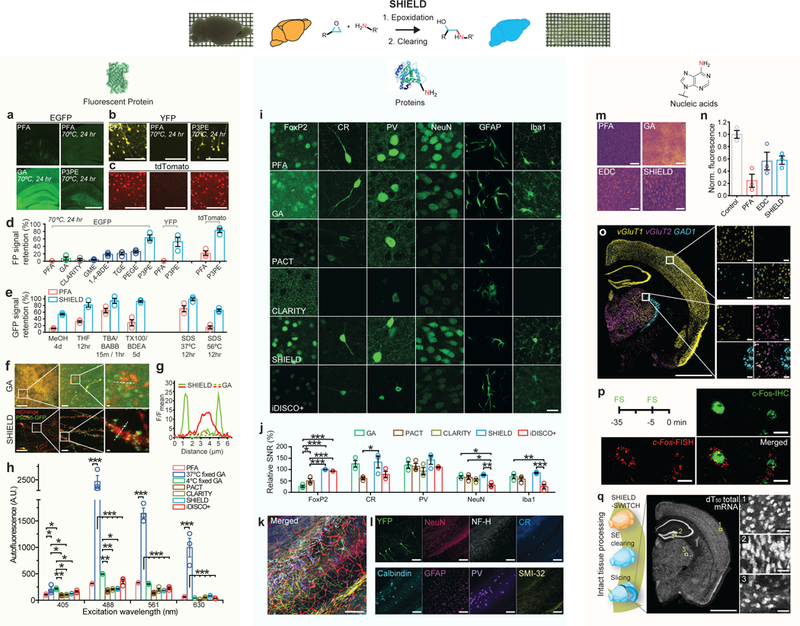
(a-c) Representative FP signals of brain slices subjected to thermal treatment after processed with fixatives (PFA, GA, or P3PE). Brain slices expressing EGFP (Thy1::EGFP M-line), YFP (Thy1::YFP H-line), or tdTomato (PV-Cre / loxP-tdTomato) were used. Scale bar = 1 mm (a), 100 μm (b,c) (d) FP signal retention after the same heat treatment in brain sections preserved with difference fixatives and CLARITY. N=3 tissues. (e) GFP signal retention from M-line slices after exposure to organic solvents and detergents. MeOH, methanol; THF, tetrahydrofuran; TBA, tert-butyl alcohol; BABB, one part benzyl alcohol and two parts benzyl benzoate; TX100, Triton-X100; BDEA, butyldiethanolamine. N=3 tissues. (f) Fluorescence images of neurons virally labeled with RV-hSyn-mOrange-p2A-PSD95-GFP in GA and SHIELD tissue. Scale bars = 100, 10, and 1 μm (left to right). (g) Fluorescence intensity profiles of PSD95-GFP (green) and mOrange (red) signals along the dotted lines in f. (h) Tissue autofluorescence from various excitation wavelengths. N=3 tissues. (i) Representative images comparing the immunofluorescence of key cell-type antibodies in tissues prepared by various tissue processing methods. Scale bar = 20 μm. FoxP2, forkhead box protein P2; CR, calretinin; PV, parvalbumin; NeuN, neuronal nuclei; GFAP, glial fibrillary acidic protein; Iba1, ionized calcium-binding adapter molecule 1. The same imaging and display settings were used for each antibody. (j) Signal to noise ratios (SNR) of immunofluorescence in i normalized to the SNR of PFA control. N=3 tissues. (k, l) SHIELD preserves endogenous YFP fluorescence during multiple rounds of immunostaining and destaining. (k) Overlay of multi-round immunostained images. Scale bar = 100 μm. (l) Images from individual rounds. Scale bar = 100 μm. (m) Representative heatmaps of fluorescence in situ hybridization (FISH) of total mRNAs by (dT)50-Cy3 in cleared PFA, EDC-CLARITY, GA, and SHIELD tissues. Scale bar = 100 μm. (n) Fluorescence intensities of dT50-Cy3 FISH normalized to the signal of uncleared PFA tissues (Control), N=3 tissues. (o) FISH HCR against three mRNAs in SHIELD tissue. Scale bar = 1 mm (left) or 50 μm (right panels). (p) Dual labeling of c-Fos protein and mRNA in SHIELD tissue from a mouse foot shocked (FS) twice at 35 and 5 minutes before sacrifice. Scale bar = 10 μm. (q) Uniform preservation of transcripts in a SHIELD-processed brain hemisphere cleared with stochastic electrotransport (SE). See Supplementary video 1. Scale bar = 2 mm (left) or 100 μm (right panels). Mean +/− standard error mean was used to plot all the bar graphs. One-way ANOVA, Turkey’s multiple comparison test, *P<0.05, **P<0.01, ***P<0.001.