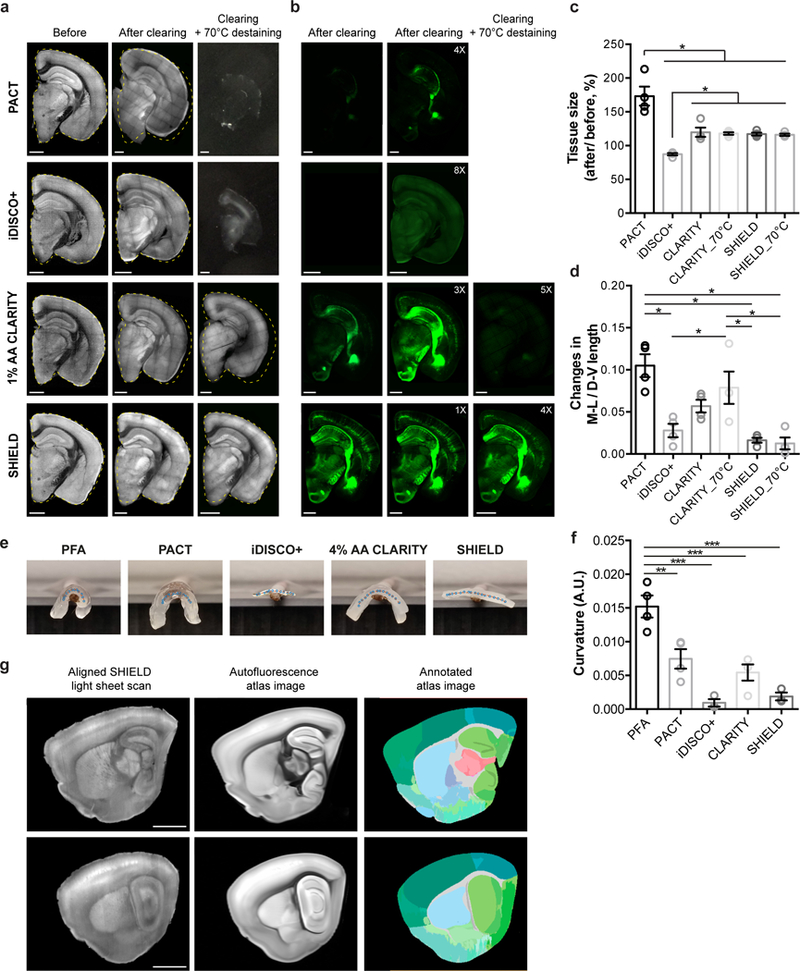
Figure 3. SHIELD protects tissue architecture against physical and chemical stressors.

(a-b) Autofluorescence (a) and YFP (b) images of 1 mm-thick brain blocks before and after clearing, and after additional 70°C destaining step (2 hr in 300 mM SDS). The yellow dotted lines mark the original contour of the blocks before clearing. Numbers in YFP images indicate intensity gain by adjusting the display range of the images. Scale bars = 1 mm. (c) Tissue size change after delipidation and optical clearing. CLARITY_70°C indicates 1% AA CLARITY tissue destained at 70°C for 2 hr after 37°C delipidation. N=4 tissues. (d) Tissue deformation quantified by changes in the ratio of medio-lateral (M-V) and dorso-ventral (D-V) length of tissue block. N=4 tissues. (e) Photos of cleared 1 mm-thick mouse brain sagittal blocks on a rod. Interpolated centerlines of the tissues were marked with dots. (f) Quantification of tissue curvature. N=3 tissues. (g) Fully automated registration of autofluorescence images from a SHIELD mouse brain sample to autofluorescence images of Allen brain atlas (© 2015 Allen Institute for Brain Science. Allen Brain Atlas API. Available from: brain-map.org/api/index.html). Scale bar = 2 mm. Mean +/− standard error mean was used for all the bar graphs. One-way ANOVA, Turkey’s multiple comparison test, *P<0.05, **P<0.01, ***P<0.001.
