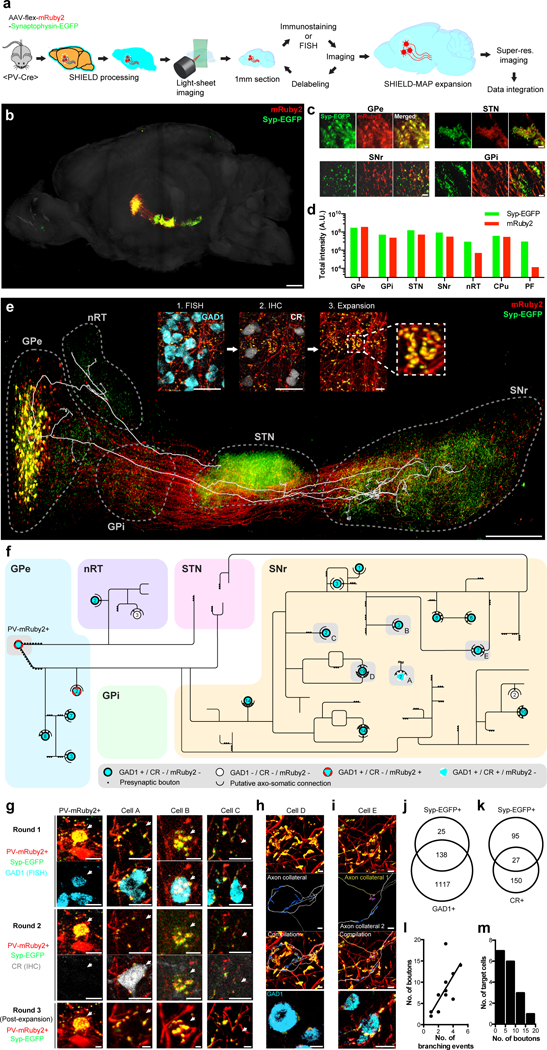
Figure 6. SHIELD enables integrated circuit reconstruction at single cell resolution.

(a) Pipeline. (b) 3D rendering of the intact mouse hemisphere showing brain-wide projection patterns of labeled GPe-PV+ neurons. See Supplementary video 9. (c) Representative images of labeled neurons and their pre-synaptic terminals in GPe, STN, SNr, and GPi. (d) Total pixel intensity of mRuby2 and EGFP in seven brain regions to which the labeled GPe-PV+ neurons project. (e) 3D rendering of labeled GPe-PV+ neuronal circuitry with the overlaid axon trace of a single labeled neuron. The inset shows example images from multiround staining and multiscale imaging. Scale bar = 1 mm (50 μm for insets). (f) Reconstructed axon arborization of the neuron and its downstream targets. Each circle represents a neuron. The number of putative axosomatic boutons is marked inside each circle. (g) Images of the circuit components from multiround imaging. The arrow indicates the target cell body. Scale bars = 20 μm. (h) Reconstructed putative axosomatic connectivity. Ramified axons (gray) and EGFP+ presynaptic boutons (blue) are segmented. Scale bars = 20 μm. (i) Convergence of two axon collaterals branched remotely from the target cell body. See Supplementary video 11 for a 3D reconstruction of this connectivity. (j-k) Venn diagram showing three different neuronal populations in the SNr. (j) GAD1+ / Syp-EGFP−, GAD1+ / Syp-EGFP+, and GAD1− / Syp-EGFP+. (k) CR+ / Syp-EGFP−, CR+ / Syp-EGFP+, and CR− / Syp-EGFP+. Unbiased sampling was used. (l) A relationship between the number of axosomatic boutons and the axonal branching events of the reconstructed PV-mRuby2+ neuron near the target neuronal soma. Linear regression, R2 = 0.55, F-test = 17.40, P = 0.0009. N=11 connections. (m) The distribution of the number of putative axosomatic boutons. Mean +/− standard error mean was used for all the bar graphs.
