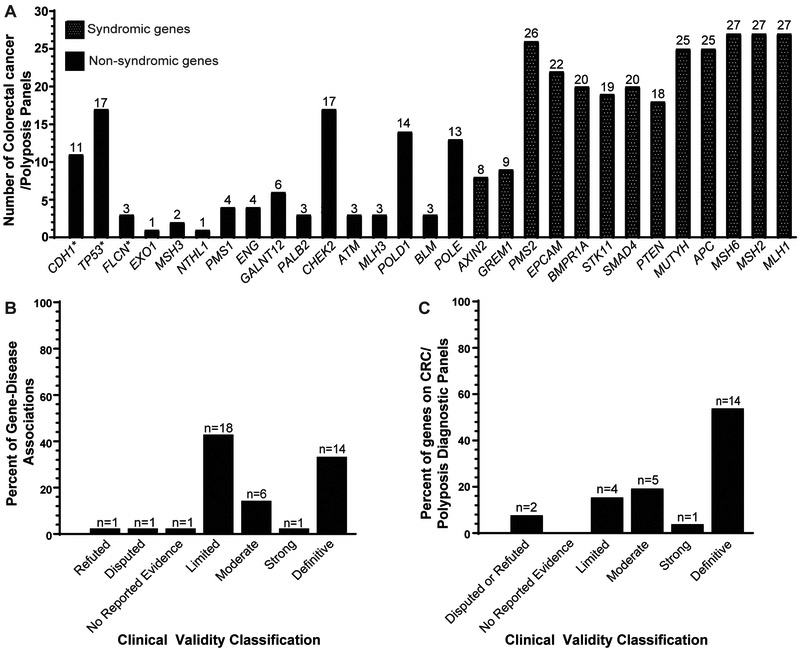
Figure 2.
Distribution of genes and clinical validity classifications on clinically available hereditary colorectal cancer and/or polyposis susceptibility testing panels. A. Quantity of testing panels containing each gene shown in a bar graph of the total number of testing panels for each gene curated as part of a gene-disease pair (See Figure 1, Table 1, and Table S1 for the list of genes). *CDH1, TP53 and FLCN were found on testing panels, but were not assigned a clinical validity classification for either hereditary colorectal cancer or hereditary polyposis susceptibility. B. Percent distribution of each clinical validity classification. The percentages represent the proportion of the 42 gene-disease pairs assigned a certain clinical validity classification. C. Percent distribution of classifications for genes listed on testing panels. The percentages represent the number of genes within a given clinical validity classification out of all genes that (i) were assessed in this manuscript and (ii) exist on testing panels (n=26 genes). For genes curated multiple times for different inheritance patterns, the highest clinical validity classification was used for plotting the graph (e.g. MUTYH was considered a Definitive gene for the graph although it was Definitive for biallelic MUTYH-associated polyposis, but Moderate for monoallelic isolated hereditary colorectal cancer susceptibility).

