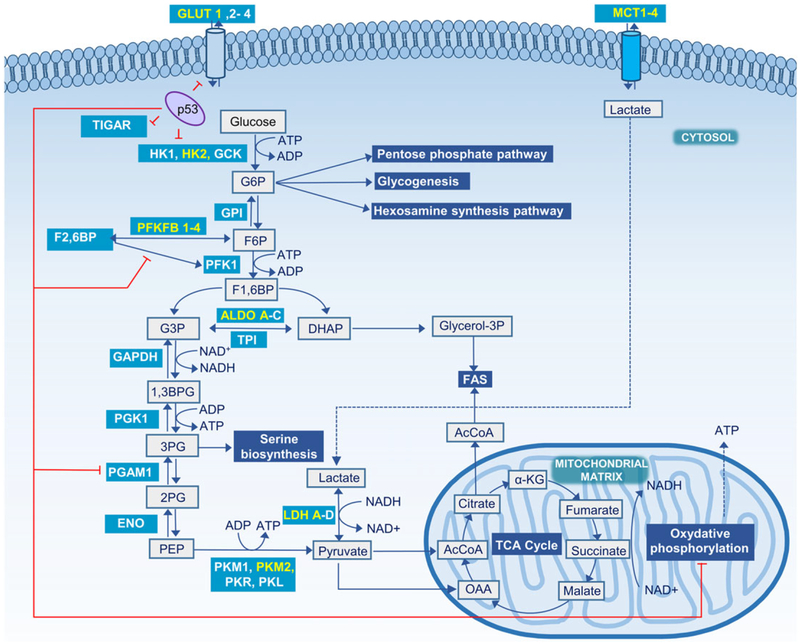
FIGURE 1.
Glycolysis and major steps in glucose metabolism. Metabolic reactions are shown in grey boxes, glycolysis associated pathways in blue-shaded boxes, and enzymes in teal-shaded boxes with those predominant in cancer cells highlighted in yellow. Sites regulated by the tumor suppressor protein p53 are indicated with red lines. 1,3BPG, 1,3-bisphosphoglycerate; 2PG, 2-phosphoglycerate; 3PG, 3-phosphoglycerate; α-KG, α-ketoglutarate; AcCoA, acetyl-CoA; ALDO, aldolase; DHAcP, dihydroxyacetone phosphate; ENO, enolase; F1,6BP, fructose 1,6-bisphosphate; F2,6BP, fructose 2,6-bisphosphate; F6P, fructose 6-phosphate; FAS, fatty acid synthase; G6P, glucose 6-phosphate; GAPDH, glyceraldehyde-3-phosphate dehydrogenase; GCK, glucokinase; GLUT, glucose transporter; glycerol-3P, glycerol 3-phosphate; GPI, glucose 6-phosphate isomerase; HK, hexokinase; OAA, oxaloacetate; p53, cellular tumor antigen TP53; PFK1, phosphofructokinase 1; PFKFB, 6-phosphofructo-2-kinase/fructose-2,6-bisphosphatase; PGAM1, phosphoglycerate mutase 1; PGK1, phosphoglycerate kinase 1; PK, pyruvate kinase; TPI, triosephosphate isomerase

