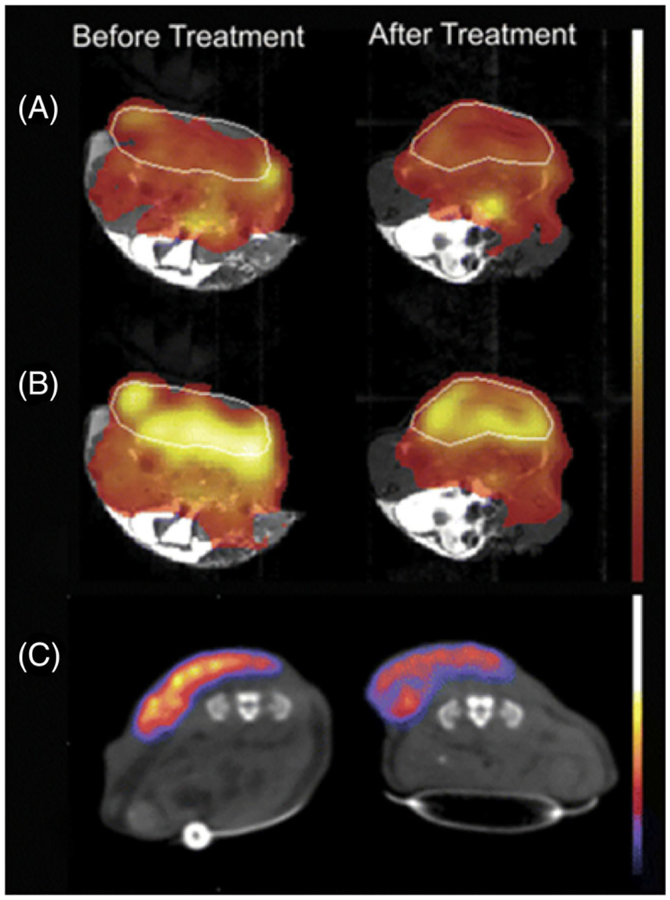
FIGURE 12.
Comparison of [1-13C] pyruvate DNP-MRS and 18F-FDG PET in a murine lymphoma model. The tumor margins are marked with a white line. A, Spatial distribution of injected hyperpolarized [1-13C] pyruvate before and 24 h after treatment with etoposide. The MR images were acquired from the same animal. Normalized 13C chemical shift images of [1-13C] pyruvate distribution are overlaid on gray-scale 1H MR images. B, Spatial distribution of hyperpolarized [1-13C] lactate after the injection of hyperpolarized [1-13C]pyruvate. C, PET images acquired between 80 and 90 min after injection of 7 MBq of 18F-FDG. Images were acquired before and after treatment, and the PET images have been overlaid on gray-scale CT images. The MRI and PET experiments were performed using different animals. (Reproduced with permission from Reference 143)

