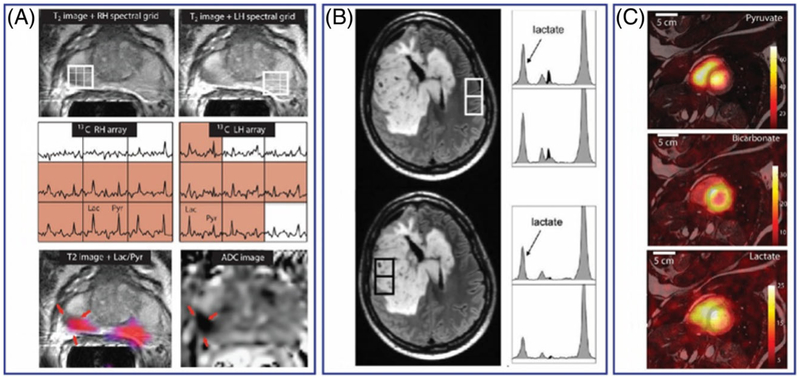
FIGURE 16.
A, Hyperpolarized 13C MRSI of a prostate tumor in a human patient. The top images show the T2-weighted MRI of the prostate. 13C spectra arrays of the voxels indicated in the above 1H image show intense lactate signal in the tumor areas. 13C lactate/pyruvate ratio maps overlaid on a 1H image and an ADC (apparent diffusion coefficient) image are shown in the bottom panel. B, Hyperpolarized 13C MRSI of a patient with brain tumor showing the lactate peaks in a tumor and normal appearing brain regions. C, Hyperpolarized13C signal intensity maps of [1-13C] pyruvate, [13C] bicarbonate, and [1-13C] lactate of the heart from a healthy volunteer. Adapted from References 136, 183, 184, and with permission

