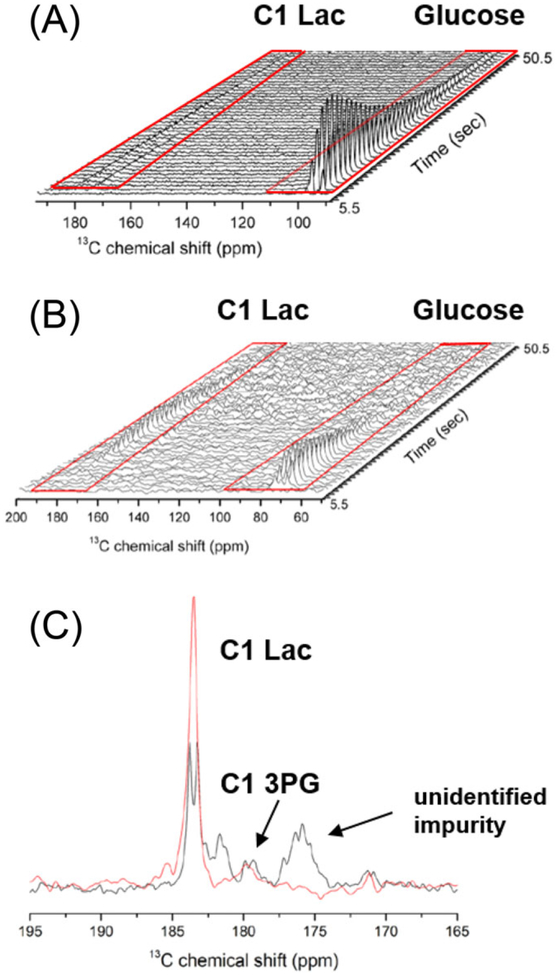
FIGURE 7.
A, B, Metabolism of hyperpolarized [U-13C6, U-2H7]-D-glucose (A) and hyperpolarized [3,4-13C2, 2,3,4,6,6-2H5]-D-glucose (B) in the mouse brain. C, The 13C signal of C1 lactate appeared as a doublet when [U-13C6, U-2H7]-D-glucose was used (black) and as a more intense singlet when [3,4-13C2, 2,3,4,6,6-2H5]-D-glucose was used (red). (Reproduced with permission from Reference 103)

