
Fig. 3.
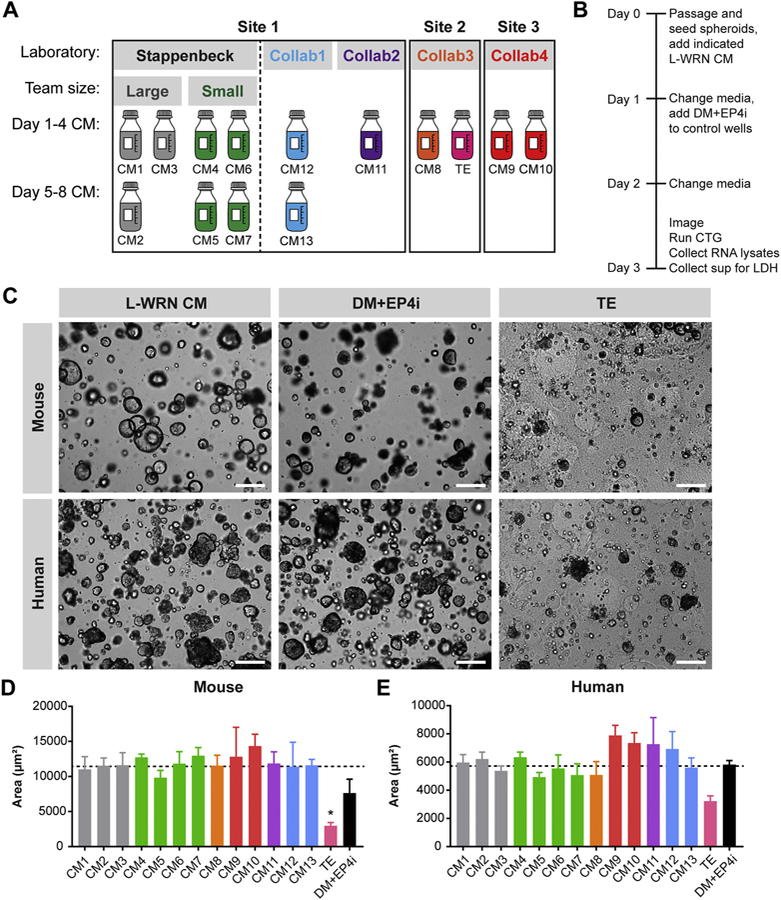
Reproducible spheroid size across multiple L-WRN CM batches.
(A) Schematic of L-WRN CM batches included in the batch-to-batch reproducibility study, including CM1–13 and the technical error (TE) batch. CM batches were collected at one of 3 institutional sites by the Stappenbeck laboratory or a collaborating laboratory (Collab1, Collab2, Collab3, Collab4). The Stappenbeck CM batches were collected by large or small teams. CM batches collected on Days 1–4 and Days 5–8 are in the upper row and lower row, respectively. (B) Schematic of experimental time line for the indicated assays. (C) Representative images from a single experiment of mouse and human colonic spheroids cultured in L-WRN CM, colonocyte differentiation medium (DM + EP4i), or the TE batch. Scale bars, 200 um. (D, E) Graphs of mouse (D) and human (E) spheroid size expressed as the average two-dimensional area (μm2; mean ± s.e.m.) from n = 3 independent experiments. *P < 0.05 by 1-way ANOVA with Dunnett’s post test relative to the average Stappenbeck CM value (represented by dashed line; 11,444 μm2 for mouse spheroids and 5706 μm2 for human spheroids).