
Fig. 4.
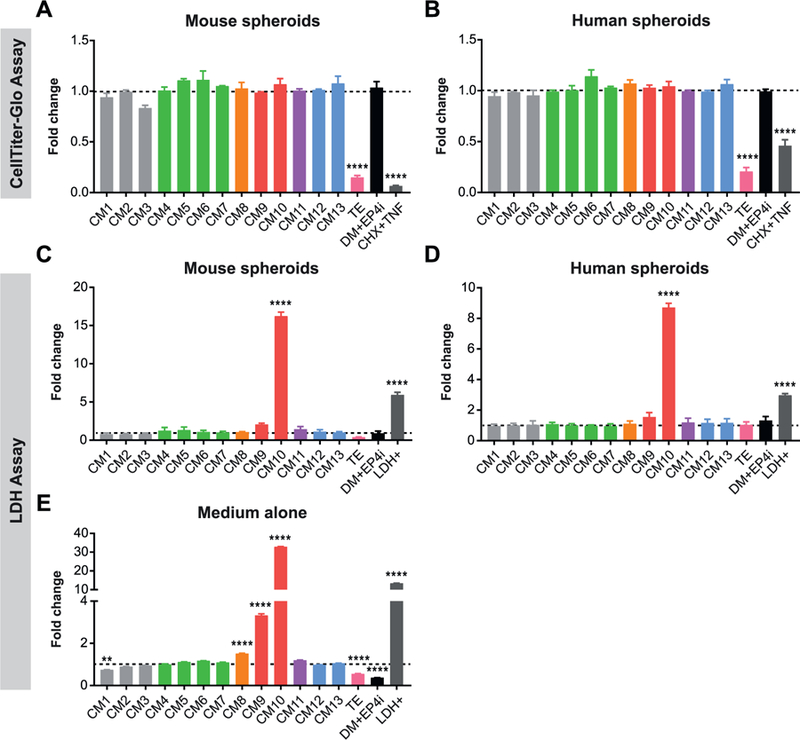
Reproducible spheroid growth across multiple L-WRN CM batches.
(A-D) Mouse (A, C) or human (B, D) spheroids were cultured in CM1–13 or TE batches of L-WRN CM followed by assessment of cell growth with the CellTiter-Glo assay (A, B) or cell death with the LDH assay (C, D). Spheroids cultured in differentiation medium with EP4 inhibitor (DM + EP4i) or treated with cycloheximide and tumor necrosis factor (CHX + TNF) served as negative controls. The positive control for LDH (LDH+) was provided with the assay kit. (A, B) Graphs of CellTiter-Glo data presented as fold change (mean ± s.e.m.) relative to the average Stappenbeck CM value; n = 3 independent experiments. (C, D) Graphs of LDH levels detected in spheroid culture supernatants presented as fold change (mean ± s.e.m.) relative to the average Stappenbeck CM value; n = 3 independent experiments. (E) Graphs of LDH levels detected in L-WRN CM batches presented as fold change (mean ± s.e.m.) relative to the average Stappenbeck CM value; n = 3 technical replicates. **P < 0.01, ****P < 0.0001 by 1-way ANOVA and Dunnett’s post test relative to the average Stappenbeck CM value (represented by dashed line).