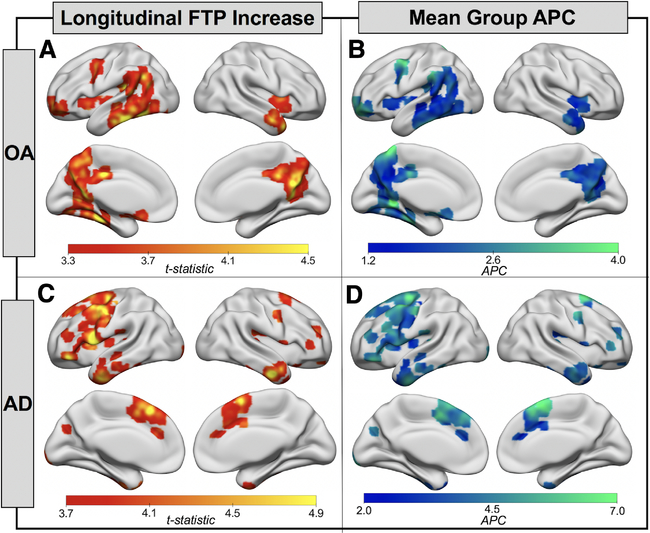
FIGURE 2:
Flortaucipir (FTP) accumulation is spatially distinct in healthy older adults (OA) and Alzheimer disease (AD). (A) Onesample t tests show regions where the OA group (n = 42) showed a significant increase in FTP from baseline to follow-up (voxel p < 0.001, cluster familywise error p < 0.05). (B) Voxelwise mean group annual percentage change (APC) in regions where FTP was significantly increasing (A) in OA. (C) One-sample t tests show regions where the AD group (n = 18) showed a significant increase in FTP from baseline to follow-up (voxel p < 0.001, uncorrected). (D) Voxelwise mean group APC in regions where FTP was significantly increasing (C) in patients with AD. Note that the upper limits of the color scales in B and D were adapted to highlight variation in mean voxelwise APC in each cohort.

