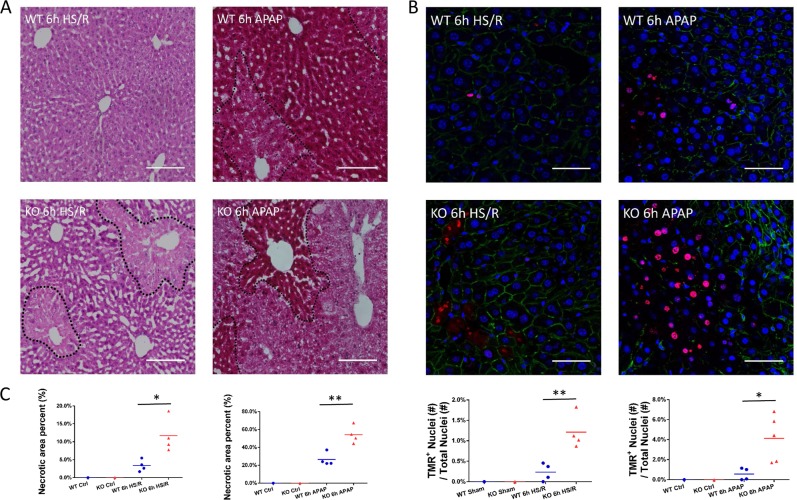
Fig. 2.
a Liver histology (H&E) in WT and GsdmD−/− (KO) liver at 6 h after hemorrhagic shock with resuscitation (HS/R) or acetaminophen overdose (APAP). Lower graphs show quantification of necrotic area. Each point represents mean values for an individual mouse across at least ten fields of view. Horizontal bar represents overall mean value. b Liver immunofluorescent TMR staining in WT and GsdmD−/− liver at 6 h after HS/R or APAP. Red = TMR-positive cells; blue = nuclei; green = actin. c Lower graphs show quantification of TMR-positive nuclei as a percentage of total nuclei. Each point represents mean values for an individual mouse across at least ten fields of view. Horizontal bar represents overall mean value. Scale bar, 40 μm. 20× Magnification. Dotted lines in H&E images outline necrotic areas. All images are representative of each group. N = 4/group. *p < 0.05 between indicated groups; **p < 0.001 between the indicated groups

