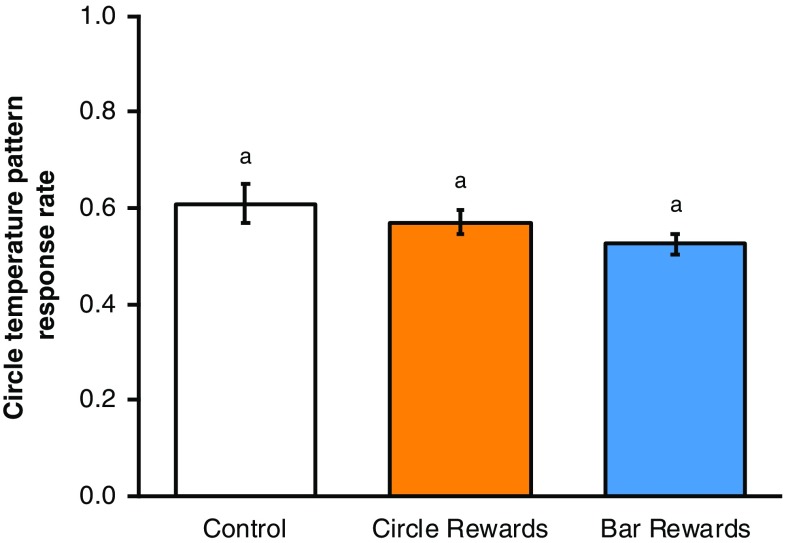
Fig. 5.
The mean circle pattern response rate (± SEM) of bumblebees conditioned in the visual pattern experiment when presented with matching temperature patterns in the cross-modality learning test, ordered by test group. Letters above bars denote groups as defined by post hoc Tukey’s test where p < 0.05

