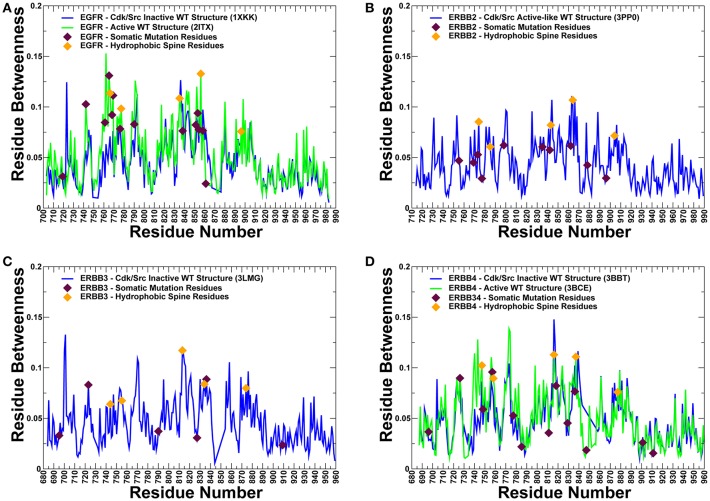
Figure 10.
The residue-based betweenness profiles of the ErbB kinase structures. The residue betweenness (residue centrality) profiles for the inactive and active crystal structure states of EGFR (A), ErbB2 (B), ErbB3 (C), and ErbB4 kinases (D). For ErbB2 and ErbB3 only crystal structures of the inactive-type states were available for the analysis. The positions of somatic mutations predicted by machine learning experiments are shown in maroon-colored filled triangles, and residue positions corresponding to the hydrophobic spine residues are shown in orange-colored filled triangles. Protein kinase activation is controlled by two networks of mostly hydrophobic residues that form a regulatory spine (R-spine) and a catalytic spine (C-spine). The EGFR R-spine residues include L777 from the β4-strand, M766 from the C-terminal end of the αC-helix, F856 of the DFG motif in the activation segment, H835 of the HRD motif of the catalytic loop, and D896 of the αF-helix.). The R-spine residues in ErbB2 are M774, L785, F864, H843, and D904. The R-spine residues in ErbB3 are I744, L755, F843, H813, and D874. The R-spine residues in ErbB4 are M747, L758, H816, F837, and D877.

