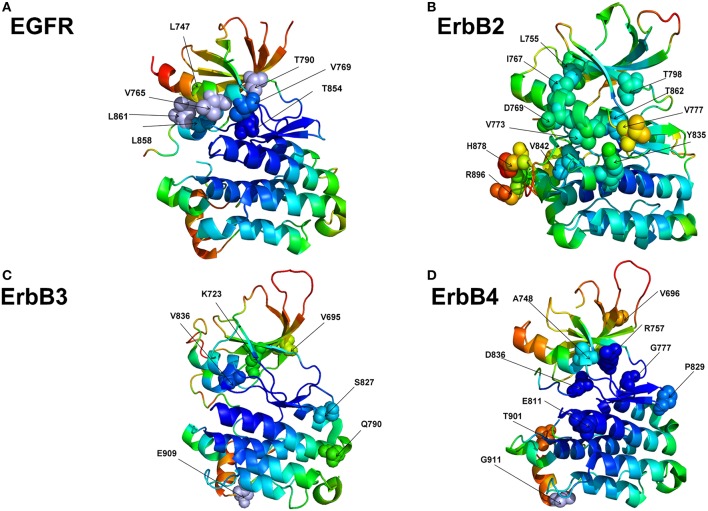
Figure 8.
Structural maps of rigidity decomposition and mobility signatures of cancer mutation drivers in the ErbB protein kinases. Structural mapping of rigidity and flexibility regions in the crystal structure of EGFR (pdb id 1XKK) (A), crystal structure of ErbB2 kinase (pdb id 3PP0) (B), crystal structure of ErbB3 kinase (pdb id 3KEX) (C), and crystal structure of ErbB4 kinase (pdb id 3BBT) (D). Crystallographic conformations are colored using a color range from red (highest flexibility) to blue (highest rigidity). The positions of predicted in machine learning cancer driver mutations are shown in spheres (colored according to their mobility level) and annotated.

