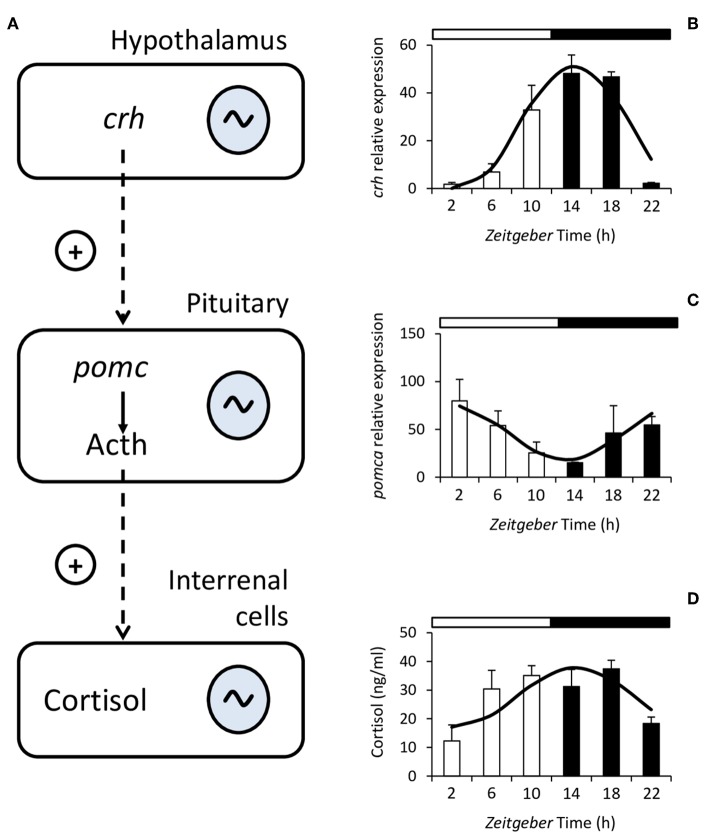
Figure 1.
Schematic diagram of the hypothalamus-pituitary-interrenal (HPI) axis (A). Corticotropin-releasing hormone (Crh) is synthesized in the hypothalamus and stimulates, at the pituitary, the synthesis and release of adrenocorticotropic hormone (Acth), which is formed from Proopiomelanocortin (Pomc). Acth stimulates the production and release of cortisol in the interrenal cells. In fish, the HPI axis presents daily rhythms at all of its levels. To the right of the figure, representative examples of the rhythms of crh expression (B), pomca expression (C), and plasma cortisol (D) from Senegalese sole are shown. Mean ± S.E.M. are represented by the bars and errors, the continuous curve represents the cosine function calculated from a significant Cosinor analysis (p < 0.05). White and black bars above the graphs represent the light and dark period, respectively. Modified with the permission of authors from López-Olmeda et al. (83).

